

Data science tutorials often simplify outlier detection, presenting it as a straightforward task of removing values beyond a few standard deviations. However, this conventional wisdom frequently falters when confronted with the complexities of real-world datasets, where distributions are skewed and stakeholders demand rigorous justification for data removal. A recent experiment, detailed in a comprehensive analysis, sought to test the consistency of five commonly used outlier detection methods on a genuine dataset of 6,497 Portuguese wines, revealing significant discrepancies and profound insights more valuable than textbook theory. This study, made available as an interactive Strata notebook and with full code access, underscores the critical importance of understanding methodological assumptions and contextual definitions of "unusual" in data analysis.
The Genesis of the Experiment: Challenging Simplistic Assumptions
The impetus for this deep dive stemmed from a common frustration among data practitioners: the theoretical ease of outlier detection rarely translates to practical application. The standard advice—"remove values greater than three standard deviations"—proves inadequate when faced with skewed data distributions, a frequent characteristic of real-world datasets. Such simplistic approaches often lead to defenseless decisions when questioned about data integrity, highlighting a critical gap between academic instruction and professional practice. To bridge this gap, the researchers designed an experiment to systematically evaluate the performance and agreement of prominent outlier detection techniques.

The chosen dataset for this empirical investigation was the publicly available Wine Quality Dataset from UCI’s Machine Learning Repository. This rich collection comprises physicochemical measurements of 6,497 Portuguese "Vinho Verde" wines (1,599 red and 4,898 white), alongside expert quality ratings. This particular dataset was selected for several key reasons: it represents production-grade data, untainted by artificial generation; its distributions are notably skewed, with six of eleven features exhibiting skewness greater than 1, thus challenging textbook assumptions of normality; and crucially, the inclusion of expert quality ratings allowed for a valuable sanity check, enabling researchers to correlate detected "outliers" with genuinely unusual wine characteristics.
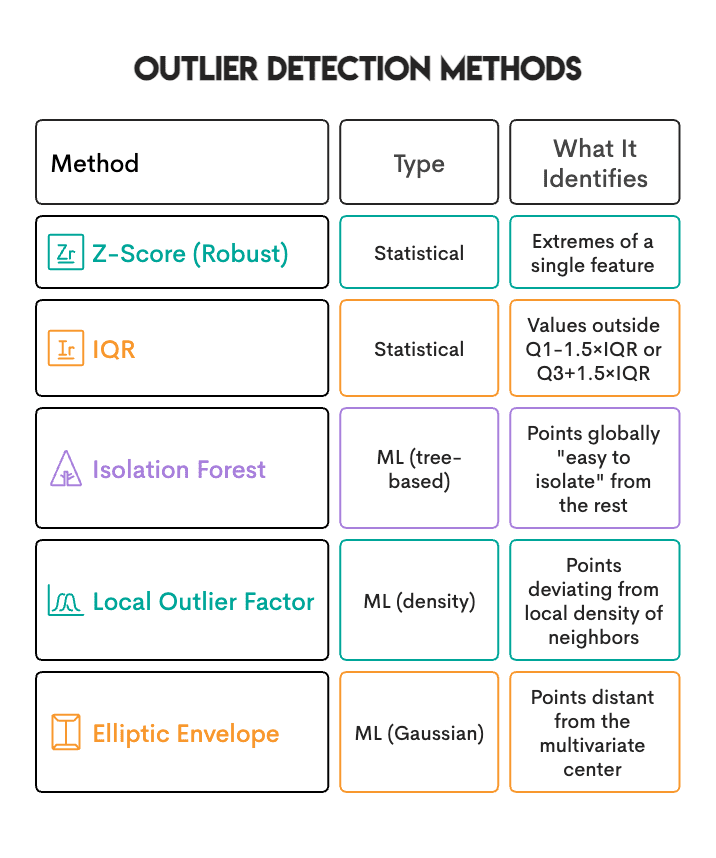
The five outlier detection methods subjected to scrutiny included both statistical rules-based approaches and machine learning algorithms:
- Standard Z-Score: A classic statistical method that measures how many standard deviations an element is from the mean. Typically, values beyond a threshold (e.g., ±3 standard deviations) are considered outliers.
- Interquartile Range (IQR): A robust statistical method that defines outliers as values falling below Q1 – 1.5 IQR or above Q3 + 1.5 IQR, where Q1 and Q3 are the first and third quartiles, respectively. It is less sensitive to extreme values than the Z-Score.
- Isolation Forest: A machine learning algorithm that isolates anomalies by randomly selecting a feature and then randomly selecting a split value between the maximum and minimum values of the selected feature. The number of splits required to isolate a sample is equivalent to the path length from the root node to the leaf node. Outliers are samples that have shorter path lengths.
- Local Outlier Factor (LOF): Another machine learning algorithm that measures the local deviation of density of a given data point with respect to its neighbors. It considers as outliers those samples that have a substantially lower density than their neighbors.
- Elliptic Envelope: A parametric method that assumes the data is generated from a Gaussian distribution and attempts to fit an ellipse (or hyper-ellipse in higher dimensions) to the central, most normal part of the data. Points outside this envelope are considered outliers.
Unveiling the First Surprise: The Multiple Testing Problem
Before any comparative analysis could commence, the researchers encountered an immediate and significant hurdle: inflated outlier counts due resulting from the "multiple testing problem." A naive approach, wherein a sample was flagged as an outlier if it exhibited an extreme value in at least one of its 11 features, produced alarmingly high outlier percentages. For instance, the IQR method initially flagged approximately 23% of wines, while the Z-Score method identified about 26%. Such figures are highly uncharacteristic of real-world datasets, where true outliers typically constitute a much smaller proportion.

The underlying statistical explanation for this inflation is straightforward. If each individual feature has, for example, a 5% probability of containing a "random" extreme value (a common threshold for statistical significance), then with 11 independent features, the probability of at least one feature being extreme in a given sample can be calculated as ( P(textat least one extreme) = 1 – (0.95)^11 approx 43% ). This means that even in a dataset where every feature’s distribution is perfectly normal, nearly half of the samples would be expected to have at least one extreme value by pure chance.
To mitigate this statistical artifact, a crucial adjustment was implemented: a sample was only flagged as an outlier if at least two features were simultaneously extreme. This redefinition shifted the focus from "any feature of the sample is extreme" to "the sample is extreme across more than one feature," significantly reducing the false positive rate. The fix was incorporated into the code by counting extreme features per sample and then applying a threshold (e.g., outlier_counts >= 2). This methodological refinement proved essential for obtaining more realistic and interpretable outlier counts, allowing the experiment to proceed with a more robust foundation.
Comparative Analysis: Discrepant Definitions of "Unusual"
With the multiple-testing problem addressed, the study proceeded to compare the number of samples flagged by each method. Post-adjustment, the counts were as follows:

- Robust Z-Score: ~3.5%
- IQR: ~3.5%
- Isolation Forest: 5%
- Local Outlier Factor (LOF): 5%
- Elliptic Envelope: 5%
A striking observation emerged regarding the machine learning-based methods (Isolation Forest, LOF, Elliptic Envelope): they all identified precisely 5% of the dataset as outliers. This is not an indicator of superior agreement or performance, but rather a direct consequence of their contamination parameter, which explicitly dictates the proportion of outliers to be detected. This parameter acts as a quota, compelling the algorithm to classify a predetermined percentage of samples as outliers, regardless of the true underlying prevalence of anomalies. This characteristic highlights a fundamental difference between threshold-based statistical methods and quota-based machine learning approaches, where the latter’s output is heavily influenced by a user-defined expectation rather than intrinsic data characteristics.
However, the true revelation came when examining the agreement between these methods. Utilizing Jaccard similarity—a metric for gauging the similarity between finite sample sets—the agreement ranged from a meager 0.10 to 0.30. This low level of similarity, far from indicating a bug, was the central finding: the methods largely identified different sets of outliers.
This profound disagreement underscores a critical insight: each outlier detection method operates on its own implicit definition of "unusual." For instance, a wine with significantly elevated residual sugar levels might be flagged as a univariate outlier by Z-Score or IQR. However, if this wine is surrounded by many other wines exhibiting similar high sugar levels (perhaps a specific dessert wine variety), LOF, a density-based method, might not flag it, as it appears "normal" within its local context. Conversely, Isolation Forest might identify a wine as an outlier if its overall chemical profile is distinct and quickly isolable, even if no single feature is extremely aberrant. Elliptic Envelope, assuming a multivariate Gaussian distribution, would identify points furthest from the estimated central distribution, which might not align with local density anomalies or single-feature extremes.
Therefore, the critical question for data scientists is not "which method is best?" but rather, "what kind of unusual am I searching for?" The answer dictates the most appropriate method or combination of methods.
Sanity Check: Outliers and Wine Quality
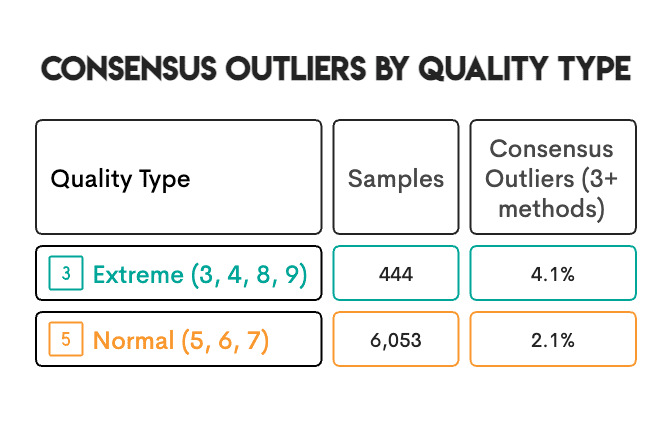
To further validate the findings and provide a real-world anchor, the researchers investigated whether the detected outliers correlated with the expert wine quality ratings (ranging from 3 to 9) present in the dataset. The hypothesis was that wines with extreme quality ratings (either very low or very high) might more frequently be identified as outliers.
The results confirmed this intuition: wines with extreme quality ratings were approximately twice as likely to be flagged as "consensus outliers" (i.e., identified by multiple methods). This finding provides a valuable sanity check, suggesting that the detected anomalies are not merely statistical artifacts but often correspond to genuinely unusual characteristics that impact expert perception. For example, a wine with excessively high volatile acidity, often associated with a vinegary taste, would likely receive a poor quality rating and also be flagged as an outlier due to its chemical composition. While this correlation suggests a connection, the study cautions against assuming a direct causal link in every instance, acknowledging the possibility of unseen patterns or confounding factors.
Critical Methodological Decisions Shaping the Results

The study’s insights were also significantly shaped by three key methodological decisions made during the experiment’s setup, each addressing specific challenges posed by the real-world dataset:
-
Utilizing Robust Z-Score Instead of Standard Z-Score: The Standard Z-Score relies on the mean and standard deviation, both of which are highly susceptible to distortion by outliers themselves. In contrast, the Robust Z-Score employs the median and the Median Absolute Deviation (MAD), which are robust statistics largely unaffected by extreme values. This choice proved crucial for skewed data: the Standard Z-Score identified only 0.8% of the data as outliers, whereas the Robust Z-Score, being less influenced by the very outliers it sought to detect, identified a more substantial 3.5%. This highlights the importance of using robust statistical measures when dealing with non-normal or outlier-prone data. The calculation involved
robust_z = 0.6745 * (data - median) / mad. -
Separate Scaling for Red and White Wines: The Wine Quality Dataset contains two distinct populations: red and white wines, each possessing different baseline chemical compositions. Combining them for scaling would lead to erroneous outlier identification. For example, a red wine with perfectly normal sulfur content relative to other red wines might appear as an outlier when compared against the combined mean of both red and white wines. To address this, the researchers scaled each wine type separately using the median and Interquartile Range (IQR) of its respective group, and then recombined the scaled data. This approach, implemented using
sklearn.preprocessing.RobustScaler, ensured that outliers were identified relative to their appropriate sub-population, preventing misclassification due to inherent group differences. -
Strategic Exclusion of Elliptic Envelope: The Elliptic Envelope method operates under the assumption that the data follows a multivariate normal (Gaussian) distribution. Given that six of the eleven features in the wine dataset exhibited skewness greater than 1 (with one reaching 5.4), this assumption was demonstrably violated. While kept in the comparison for completeness, the Elliptic Envelope was deliberately excluded from the "consensus vote." This decision underscores the paramount importance of checking a method’s underlying assumptions against the characteristics of the actual data, preventing misinterpretations arising from unsuitable model application.

Identifying the "Best" Method and Embracing Consensus
In the absence of a known ground truth—a common scenario in most real-world data science projects—determining a single "winner" among outlier detection methods is challenging, especially with data characteristics like heavy skewness and mixed populations. However, the study offered a pragmatic perspective. Robust Z-Score, IQR, Isolation Forest, and LOF all demonstrated reasonable performance with skewed data. If compelled to select a single method, Isolation Forest emerged as a strong candidate due to its lack of distribution assumptions, its ability to consider all features simultaneously, and its graceful handling of mixed populations.
Despite this, the study emphatically concluded that no single method is universally superior or exhaustive:
- Z-Score and IQR excel at identifying univariate extremes.
- Isolation Forest is effective at isolating globally unusual samples.
- LOF is adept at detecting samples that are unusual within their local neighborhood.
- Elliptic Envelope is suitable only when data conforms to a multivariate Gaussian distribution.
The more robust and reliable approach, the researchers argued, is to employ multiple methods and trust the consensus. The 143 wines flagged by three or more methods were considered far more reliable and trustworthy than any identified by a single method alone. This consensus-based approach, calculated by summing the flags from individual methods (consensus = zscore_out + iqr_out + iforest_out + lof_out) and selecting high_confidence = df[consensus >= 3], provides a higher measure of confidence in the absence of ground truth, reflecting a more robust identification of true anomalies.

Broader Implications for Data Science Projects
The findings of this experiment yield critical lessons for data science practitioners across various domains:
- Define the Problem First: Before selecting any method, clearly articulate what kind of "unusual" you are looking for. Data entry errors, measurement anomalies, and genuine rare cases each manifest differently and require tailored approaches. The nature of the problem should guide the choice of method.
- Verify Assumptions: Always examine your data’s distributions and characteristics before committing to a method. Methods like Standard Z-Score and Elliptic Envelope can lead to erroneous conclusions if their underlying assumptions (e.g., normality) are violated by heavily skewed data.
- Leverage Multiple Methods: The low agreement between different techniques highlights their distinct definitions of "outlier." Employing multiple methods and prioritizing samples flagged by a consensus of several approaches significantly increases the reliability and trustworthiness of outlier identification.
- Contextualize Outliers; Don’t Automatically Remove: An identified outlier is not necessarily an error. It could be a rare but legitimate data point, or even the most interesting observation in your dataset. Domain knowledge is indispensable in making this distinction. Algorithms merely flag what is unusual; human expertise determines its significance and appropriate handling.
Expert Recommendations and Practical Guidelines
Drawing from the insights of the experiment, several practical recommendations emerge for data practitioners:
- Starting Point for Technique Selection: Isolation Forest is often a good initial choice due to its non-parametric nature and ability to consider all features simultaneously. However, for identifying extreme values in a specific measurement (e.g., unusually high blood pressure), simpler methods like Z-Score or IQR may be more appropriate and interpretable.
- Choosing a Contamination Rate: For Scikit-learn methods (like Isolation Forest or LOF), the
contaminationparameter sets a quota for outlier detection. A common starting value is 5% (0.05). However, this rate should ideally be informed by domain knowledge about the expected proportion of true outliers in the dataset, rather than being a default choice. - Outlier Removal and Data Splitting: It is crucial to fit outlier-detection models only on the training dataset and then apply the trained model to the testing dataset. Failing to do so, by fitting on the entire dataset or removing outliers before splitting, introduces data leakage, where information from the test set implicitly influences preprocessing, leading to overly optimistic performance estimates.
- Handling Categorical Features: The methods discussed primarily apply to numerical data. For categorical features, alternatives include converting them to numerical representations (e.g., one-hot encoding), using frequency-based methods (e.g., identifying categories with very low counts), or employing specialized algorithms designed for mixed data types or categorical anomaly detection.
- Distinguishing Errors from Unusual Cases: An algorithm flags unusual data; it does not determine if something is "wrong." A wine with extremely high residual sugar might be a data entry error or a perfectly valid dessert wine. This distinction can only be made with domain expertise. When in doubt, mark potential outliers for further review rather than automatically deleting them.
Concluding Remarks
The journey through this empirical study on outlier detection methods reveals that the concept of "outlier" is far from monolithic. It is a nuanced term, its definition shifting with the analytical lens applied. Univariate statistical methods like Z-Score and IQR identify extremes along single dimensions. Multivariate machine learning algorithms such as Isolation Forest and LOF detect samples that are anomalous in their overall pattern or local density. Parametric methods like Elliptic Envelope are effective only when their distributional assumptions are met.
Ultimately, effective outlier detection is not about finding a single "best" algorithm but about aligning the method with the specific type of "unusual" phenomenon one seeks to identify. When this objective is unclear, or when robust identification is paramount, the most reliable strategy involves deploying multiple methods and leveraging their consensus. This approach, grounded in the practical realities of data analysis, empowers data scientists to make more informed, defensible decisions in the critical process of identifying and managing anomalous data points.


Leave a Reply