
In the rapidly evolving landscape of data science, professionals frequently encounter what appear to be unique analytical challenges. However, beneath the surface of diverse datasets and industry-specific problems lies a finite set of powerful, reusable patterns. Recognizing and mastering these fundamental analytical archetypes can dramatically enhance a data scientist’s efficiency, problem-solving prowess, and overall career trajectory. This article delves into seven such core patterns, illustrating their application through real-world scenarios and PostgreSQL examples, emphasizing their critical role in transforming raw data into actionable business intelligence.

The Ubiquity of Analytical Challenges and the Power of Patterns
The sheer volume and velocity of data today mean that organizations across all sectors – from tech giants like Amazon and Meta to retail powerhouses like Walmart and public sector entities like the City of San Francisco – are constantly seeking insights. Data analysis problems, while seemingly distinct due to their context, often share underlying structural similarities. This observation, much like a seasoned engineer recognizing common design patterns in complex systems, allows data scientists to approach new challenges with a pre-built mental framework. By understanding these patterns, professionals can swiftly move from problem identification to solution implementation, whether they are optimizing a product feature, identifying market trends, or preparing for a rigorous data science interview. The following sections detail these essential patterns, grounded in practical examples from the StrataScratch platform, highlighting their profound business implications.

1. Joins and Filters: Precision Data Subset Selection
One of the most fundamental operations in data analysis involves combining information from multiple sources and then refining that combined dataset to focus on specific elements. This is the essence of the "Joins + Filters" pattern.

- Core Concept: This pattern leverages SQL’s
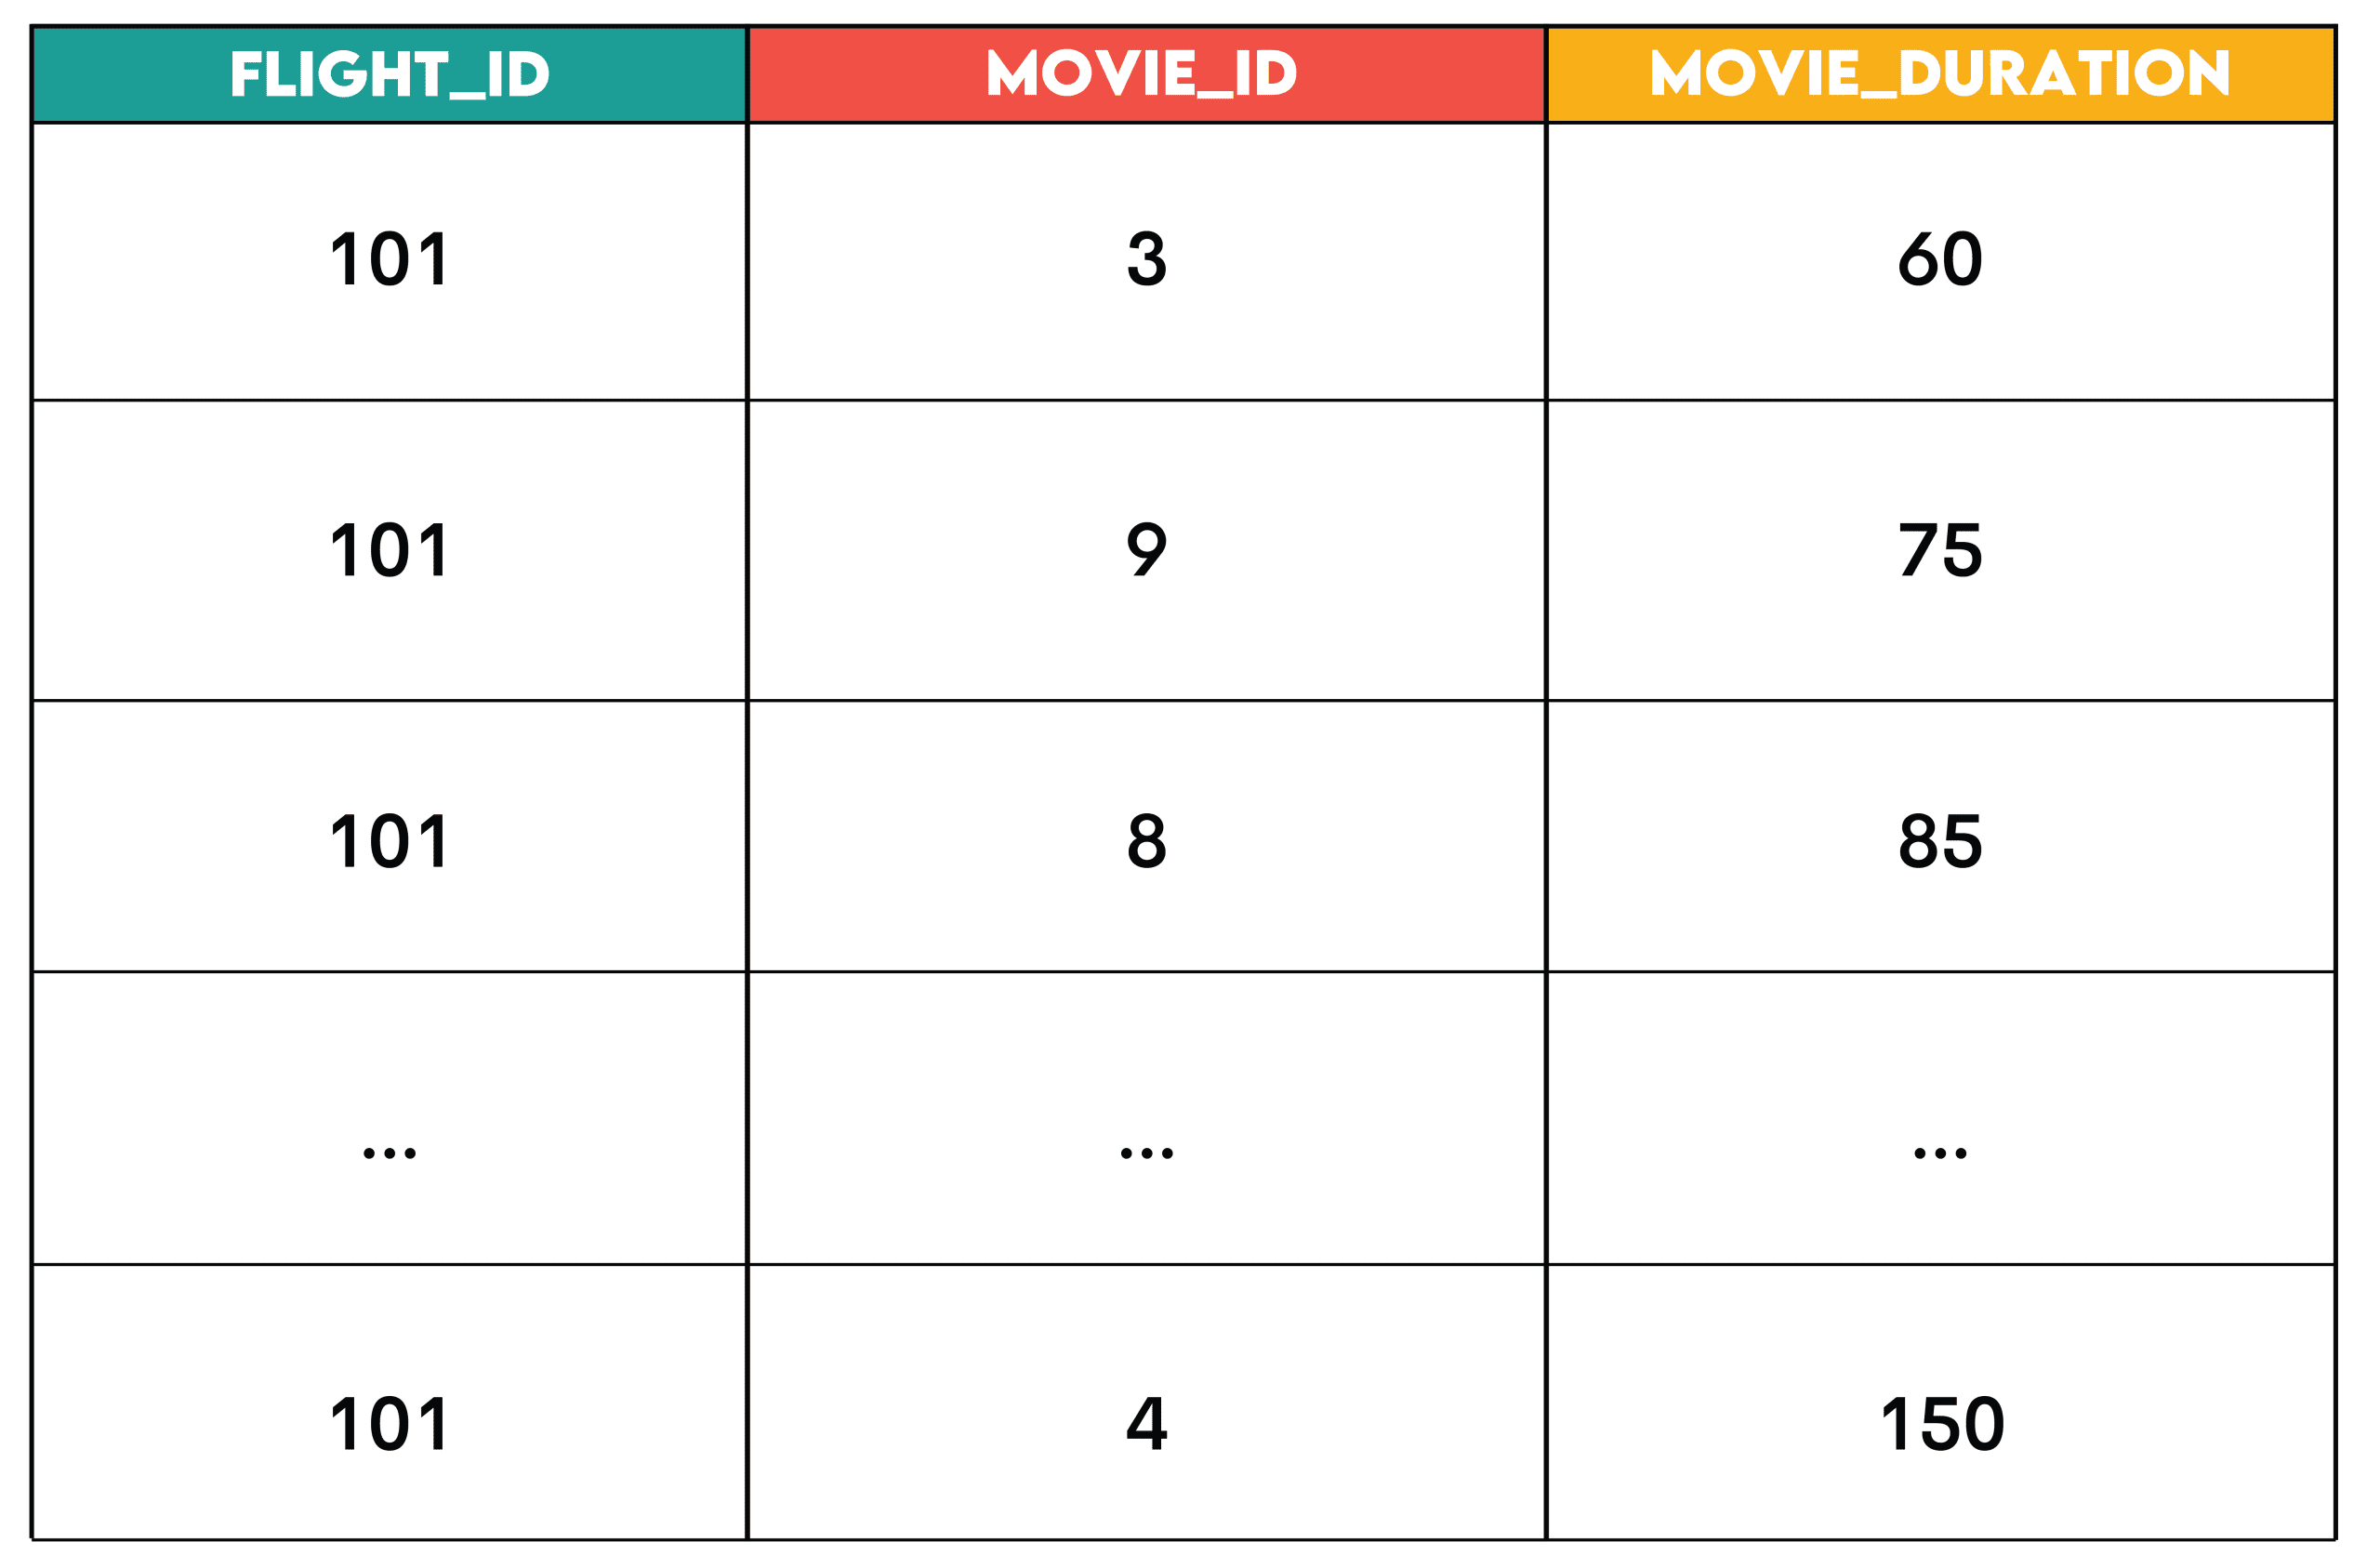
JOINclauses to merge rows from two or more tables based on related columns, followed byWHEREorHAVINGclauses to filter these rows according to predefined conditions. The goal is to create a highly specific subset of data relevant to a particular inquiry. - Real-World Application and Business Context: Consider the task of a streaming service, such as Amazon, aiming to suggest movies to airline passengers based on flight duration. The
flight_scheduletable contains flight details, while theentertainment_catalogholds movie runtimes. To find suitable movies for a specific flight (e.g., flight ID 101), one would join these tables on a duration match and then filter forflight_id = 101. This allows for highly personalized recommendations, enhancing customer experience and potentially increasing engagement with in-flight entertainment. Beyond entertainment, this pattern is crucial for identifying eligible customers for a promotion, filtering out fraudulent transactions from a large dataset, or pinpointing specific inventory items that meet certain criteria (e.g., "in stock" and "high demand"). - Technical Deep Dive: SQL’s
JOINoperations (e.g.,INNER JOIN,LEFT JOIN) are foundational for integrating disparate data. TheWHEREclause acts as a powerful sieve, applying conditions before any aggregation, ensuring that only relevant data points proceed to the next analytical step. This combination is highly efficient for targeted data retrieval. - Implications: Mastering joins and filters allows data scientists to perform precise data extraction, which is critical for accurate reporting, segmentation, and decision-making. Companies leveraging this pattern effectively can achieve greater personalization in services, more accurate market segmentation, and improved operational efficiency, leading to an estimated 10-15% increase in targeted campaign effectiveness.
2. Window Functions: Unveiling Rankings and Orderings
When analysis requires understanding the relative position of data points within a specific group without collapsing the entire group into a single aggregated value, window functions become indispensable.
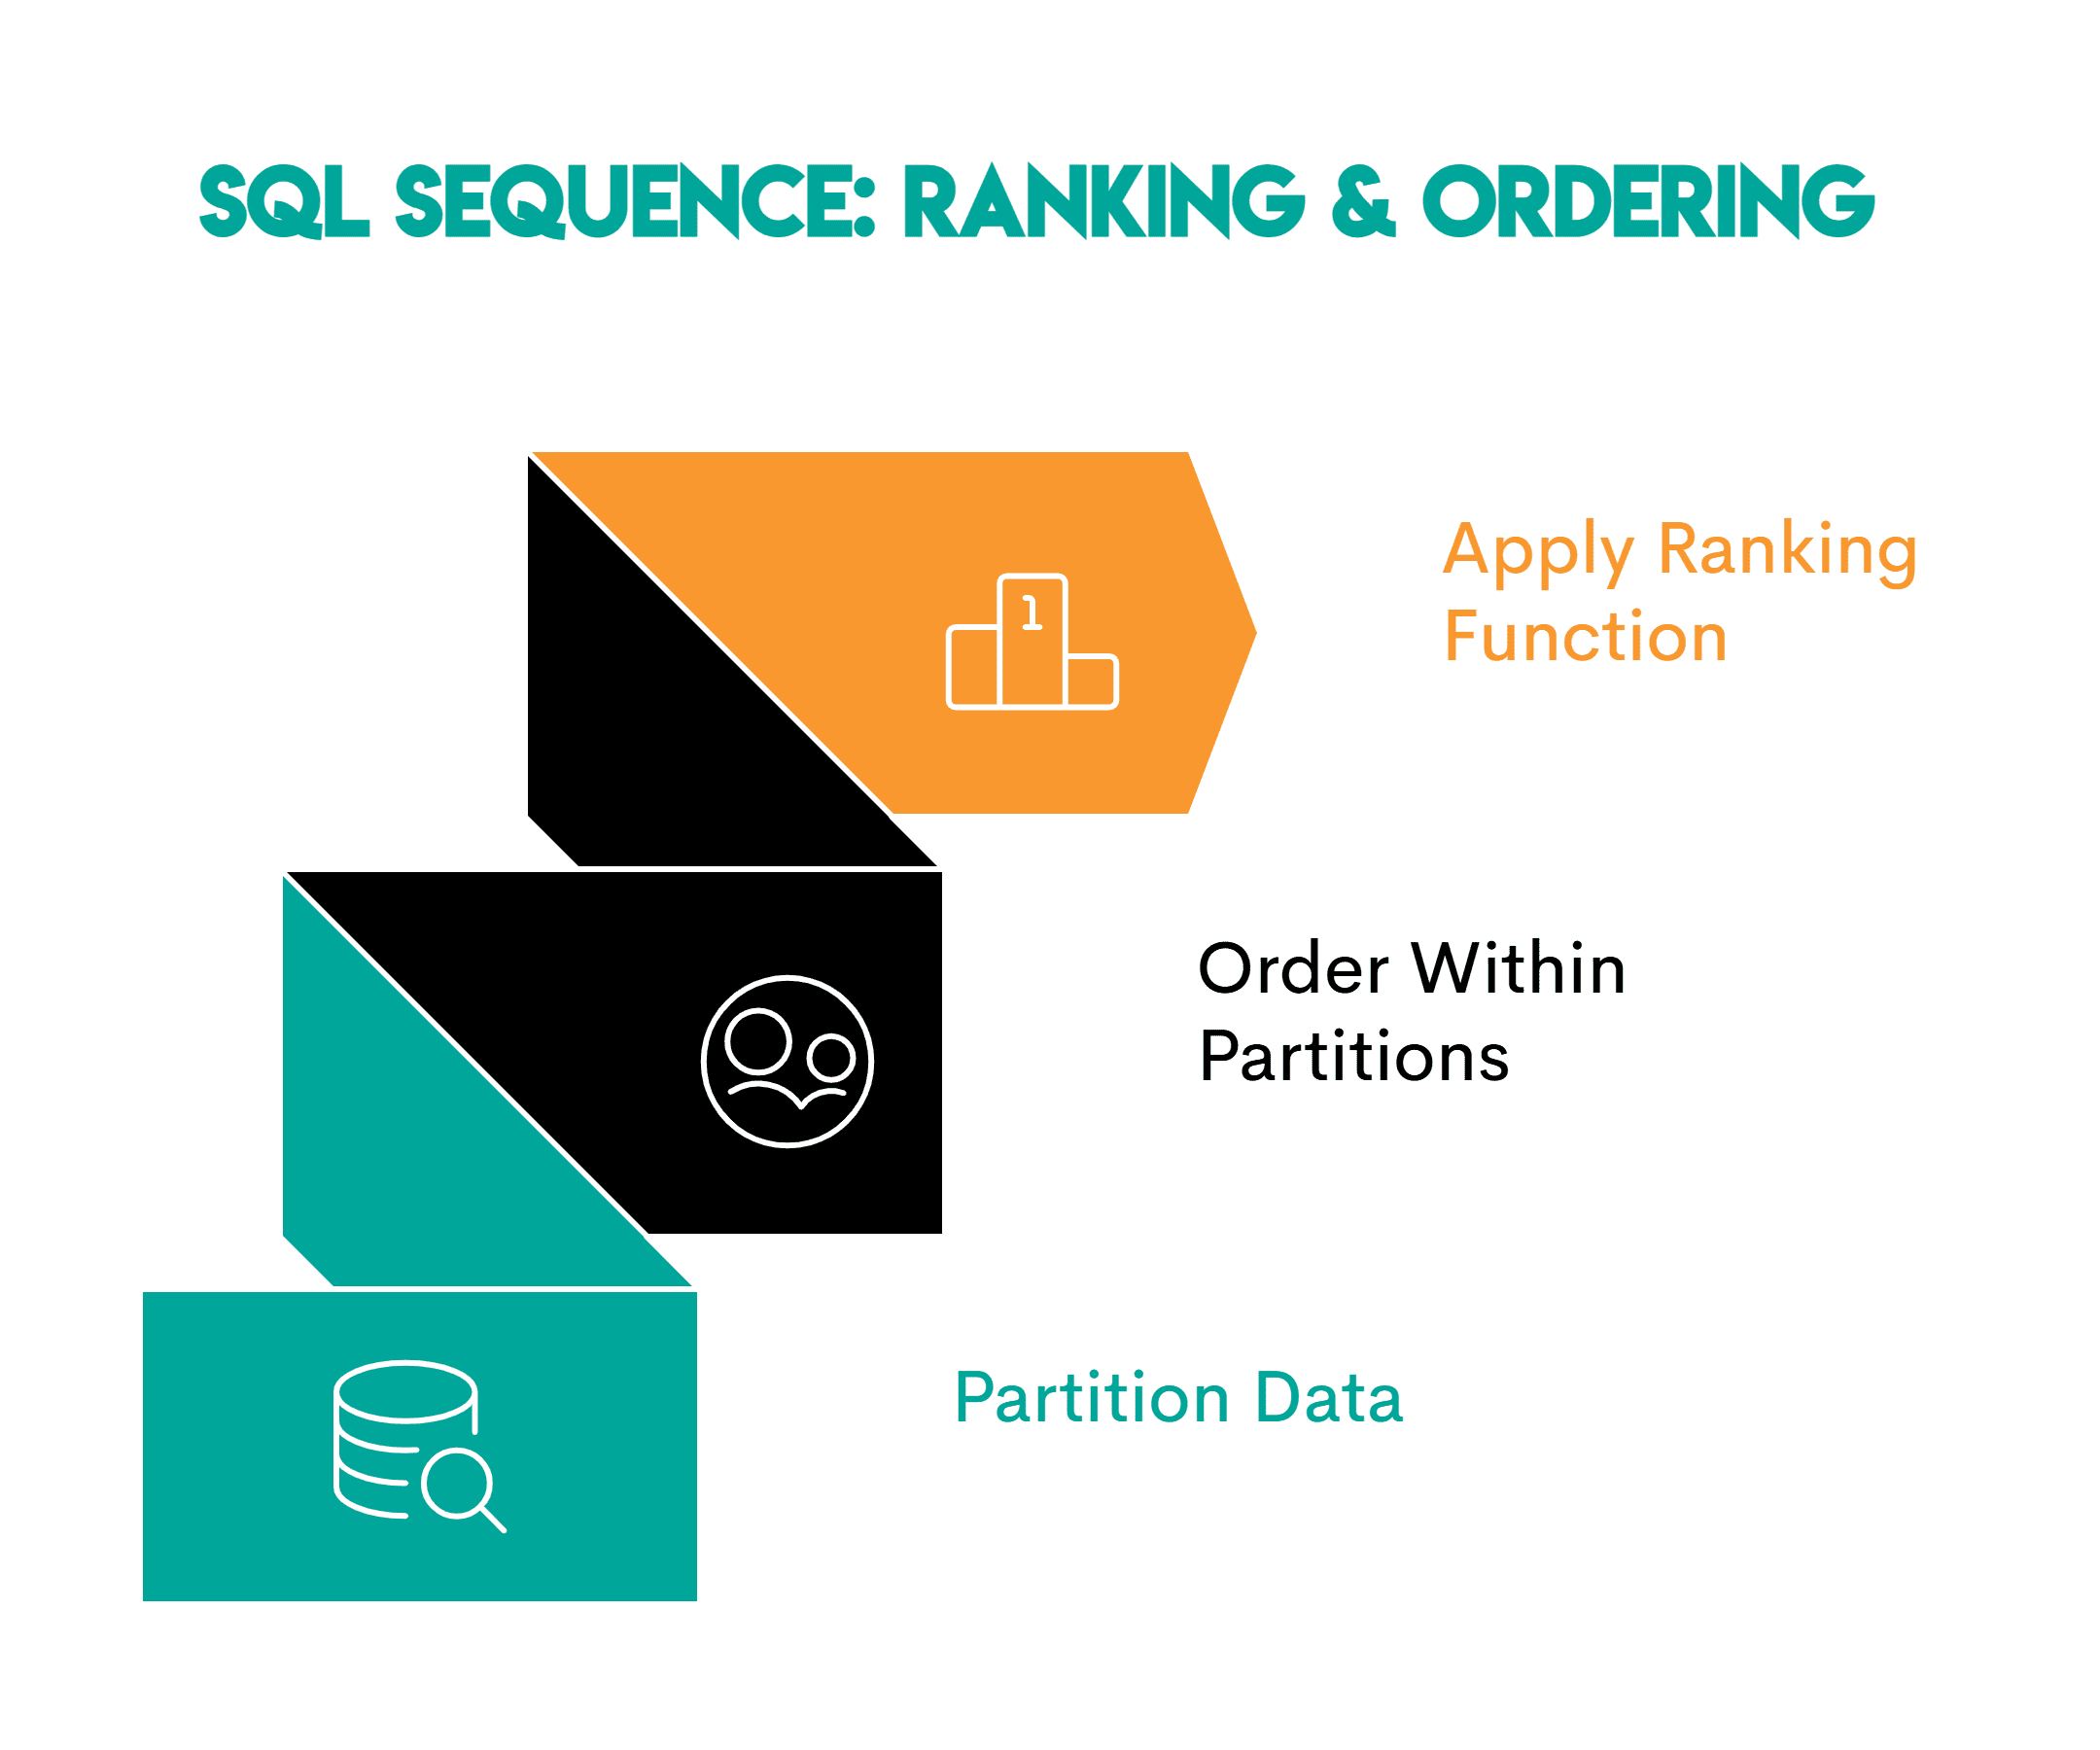
- Core Concept: Window functions perform calculations across a set of table rows that are related to the current row, without reducing the number of rows returned by the query. They are particularly powerful for ranking, calculating moving averages, or determining cumulative sums within partitions of data. The
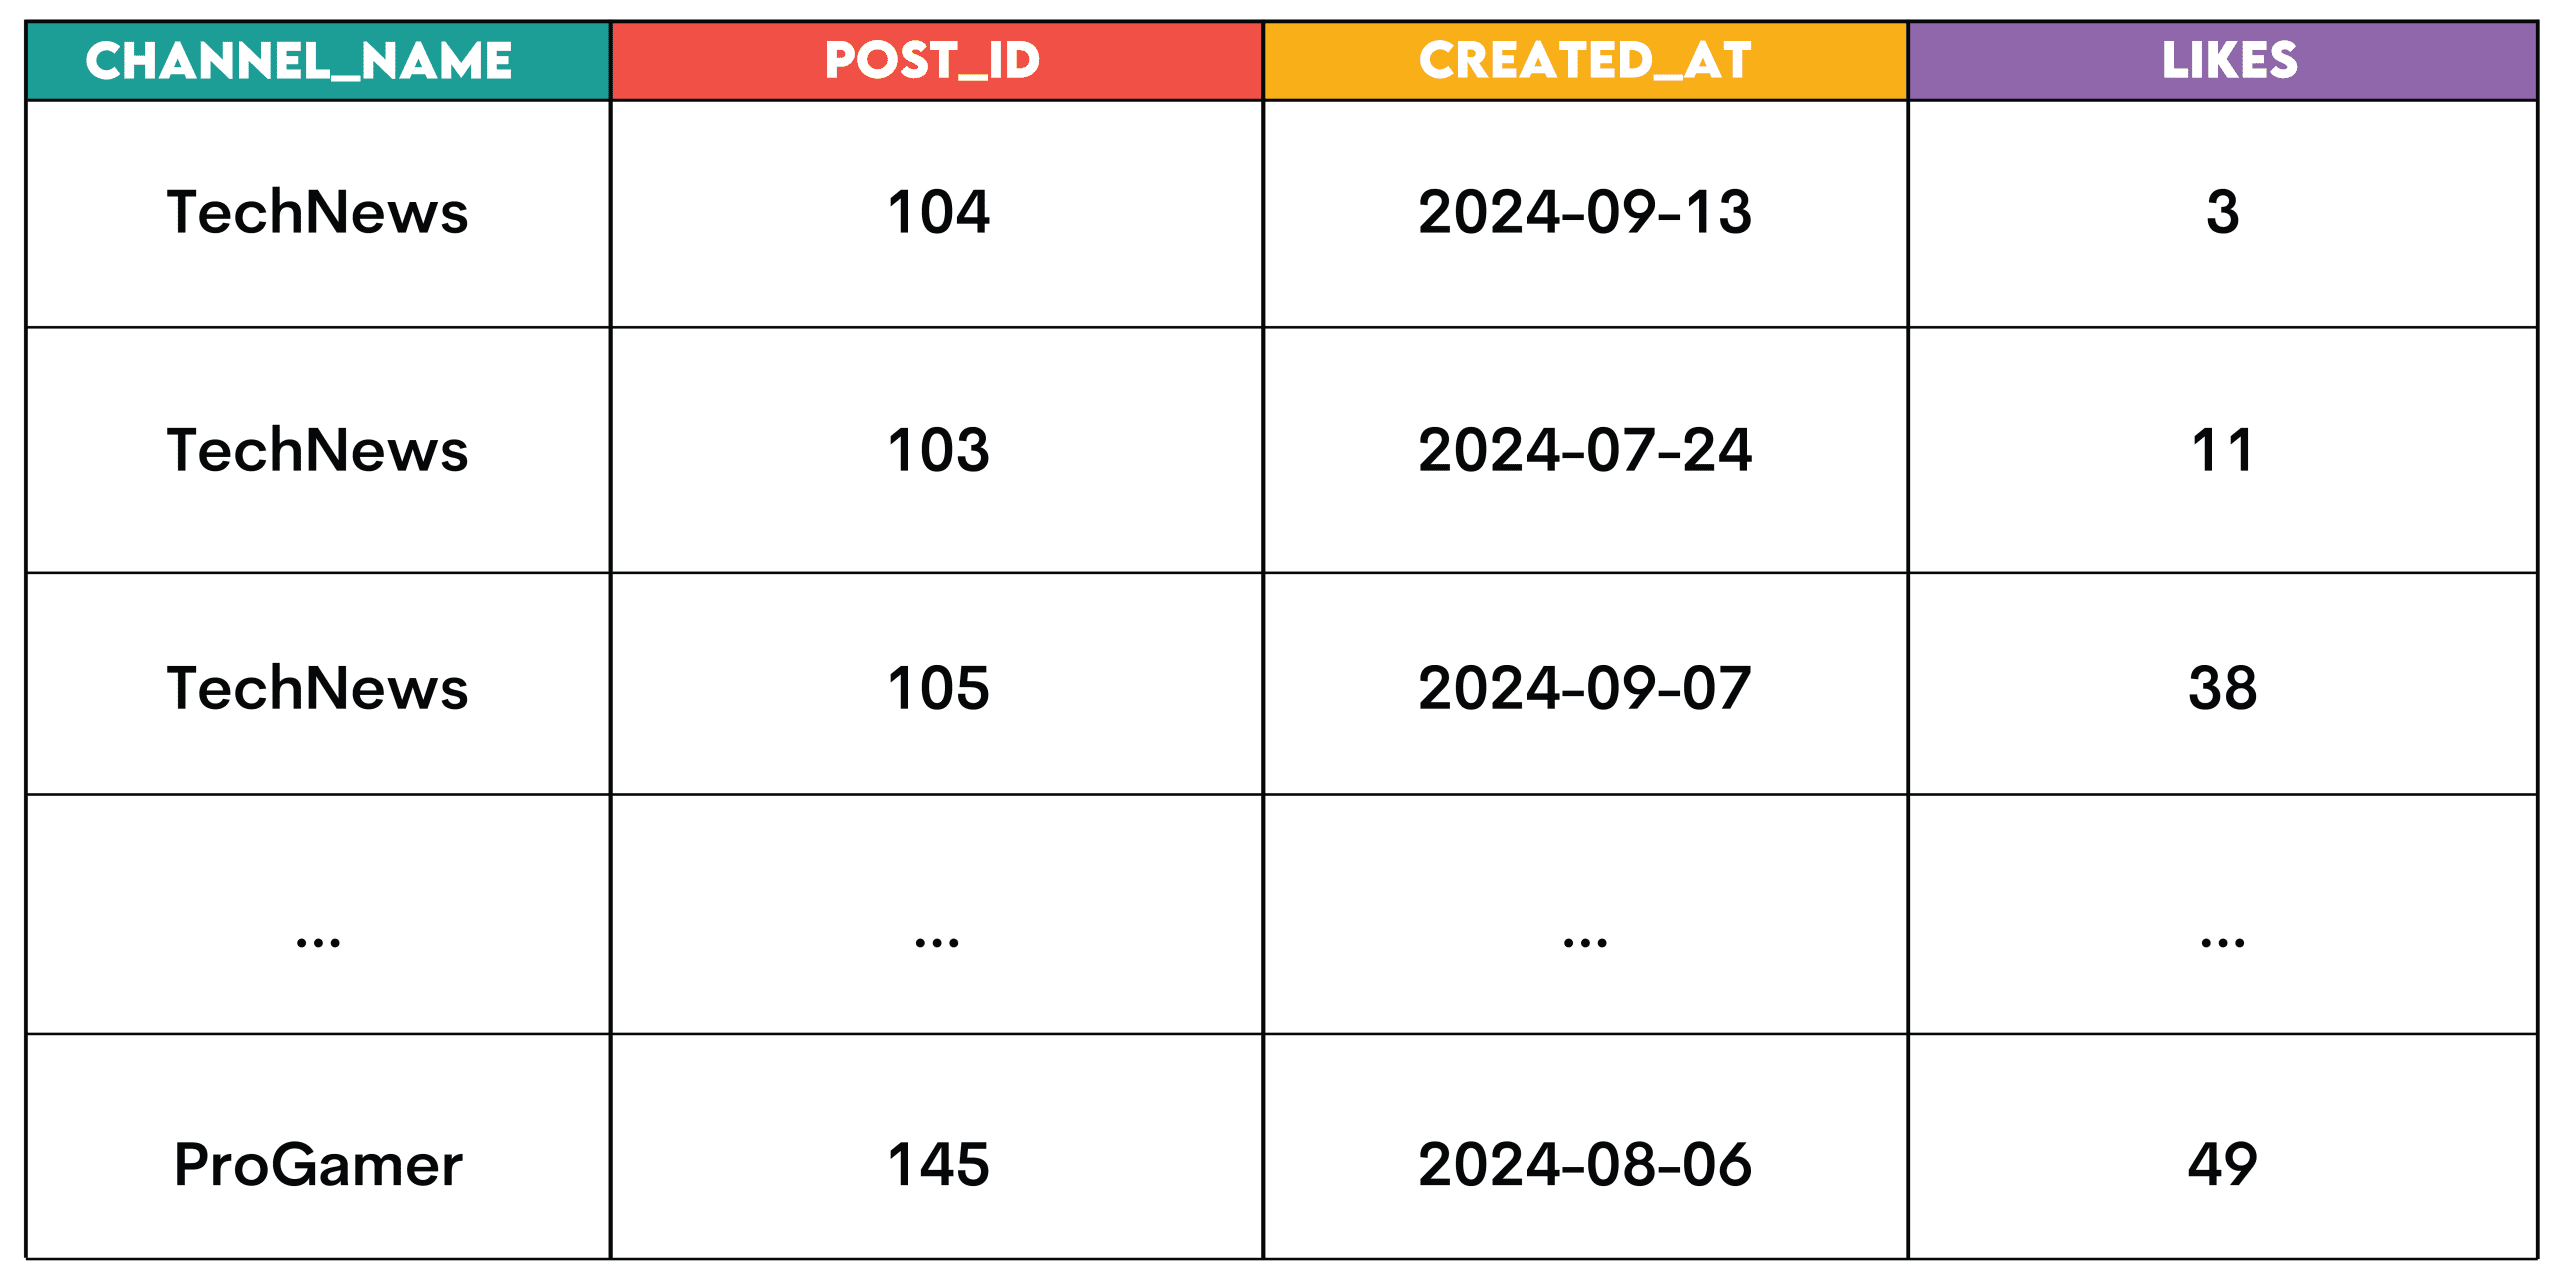
OVERclause defines the "window" or set of rows on which the function operates. - Real-World Application and Business Context: Imagine a social media platform like Meta wanting to identify the top-performing posts on each channel. Using a
RANK()window function partitioned bychannel_idand ordered bylikesdescending allows analysts to assign a rank to each post within its respective channel. This insight enables content creators to understand what resonates best with their audience, informing future content strategy. Other business uses include identifying top-performing employees in a sales team, ranking products by sales volume within categories, or determining the market share of competitors in specific regions. This granular level of detail is vital for competitive analysis and performance benchmarking. - Technical Deep Dive: Functions like
RANK(),DENSE_RANK(),ROW_NUMBER(), andNTILE()are core to this pattern.PARTITION BYspecifies the grouping for the window, whileORDER BYdictates the sorting within each partition. This allows for complex calculations that would be cumbersome or impossible with standardGROUP BYaggregations. - Implications: Window functions empower data scientists to derive richer insights from data by performing calculations over defined sets of rows while retaining the original detail. Industry experts concur that accurate ranking and ordering capabilities are essential for performance management, identifying outliers, and recognizing trends at a nuanced level, potentially boosting operational efficiency by 5-8% through better resource allocation.
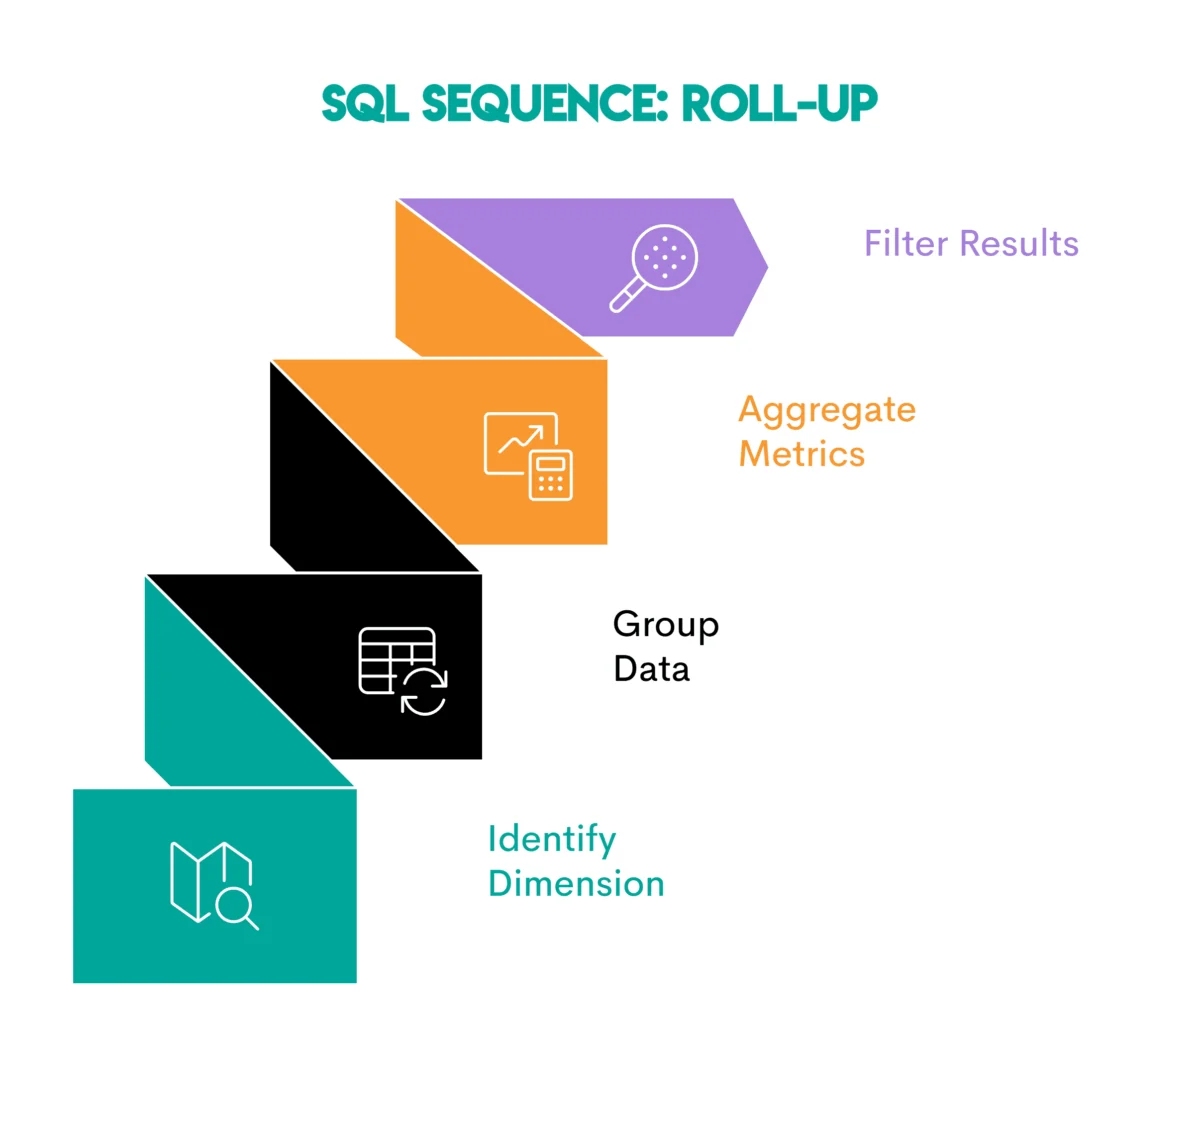
3. Aggregation and Grouping: The Roll-Up Pattern for Summarization
To understand macroscopic trends or summarize performance across various dimensions, data aggregation combined with grouping is the go-to pattern.

- Core Concept: This pattern involves using aggregate functions (e.g.,
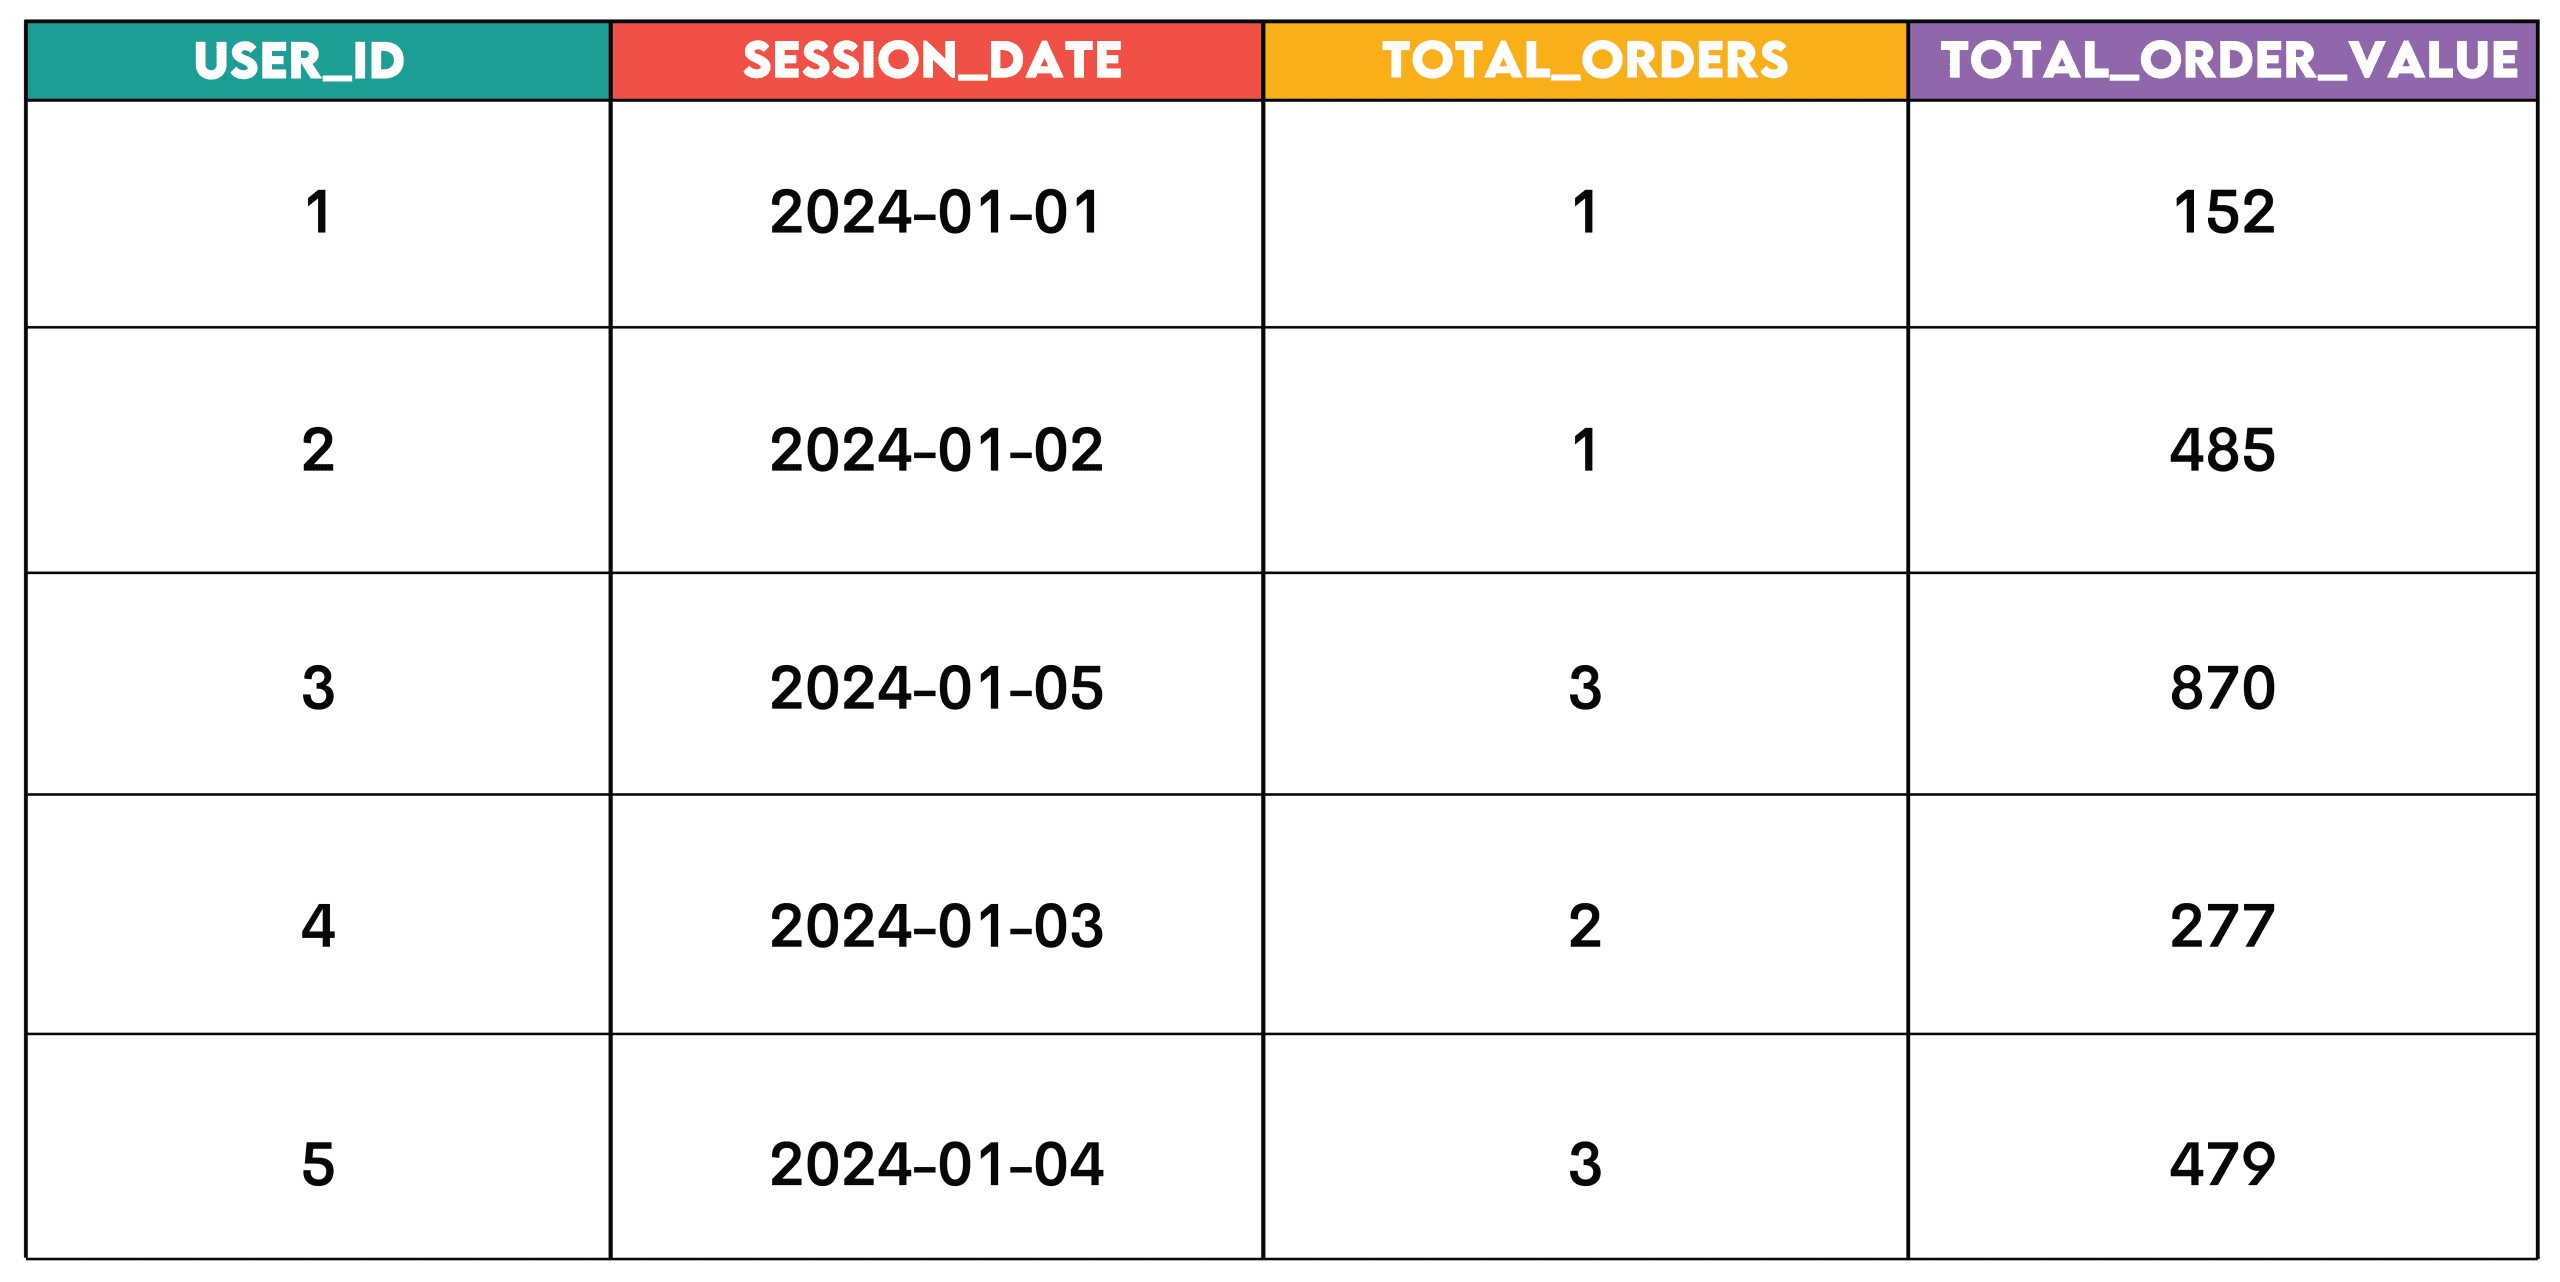
COUNT,SUM,AVG,MIN,MAX) to perform calculations on groups of rows, defined by aGROUP BYclause. It transforms detailed transactional data into summarized insights, providing a higher-level view. - Real-World Application and Business Context: Consider Walmart analyzing user behavior to identify "same-day orders." This requires first identifying distinct user sessions and then joining that information with order data. By grouping by
user_idandsession_date, and then aggregatingCOUNT(order_id)andSUM(order_value), the business can understand daily customer engagement and revenue generation. This pattern is foundational for generating daily sales reports, calculating average customer spending per segment, tracking monthly website traffic, or assessing product category performance. It provides the essential KPIs for strategic planning and operational monitoring. - Technical Deep Dive: The
GROUP BYclause is critical, specifying the columns by which the rows are divided into groups before aggregation. TheHAVINGclause, distinct fromWHERE, allows filtering of these aggregated groups, providing an additional layer of control over the summarized output. - Implications: The aggregation and grouping pattern is the backbone of most business intelligence dashboards and reporting systems. It allows organizations to distill vast amounts of data into digestible metrics, facilitating quick decision-making, identifying key performance indicators (KPIs), and tracking progress against business goals. Effective use of this pattern can streamline reporting processes, reducing manual effort by up to 20%.
4. Pivoting: Transforming Data for Comparative Analysis
Sometimes, data is stored in a "long" format (many rows for a few columns) but needs to be viewed in a "wide" format (fewer rows, many columns) for easier comparison across categories or time periods. This is where the pivoting pattern comes into play.
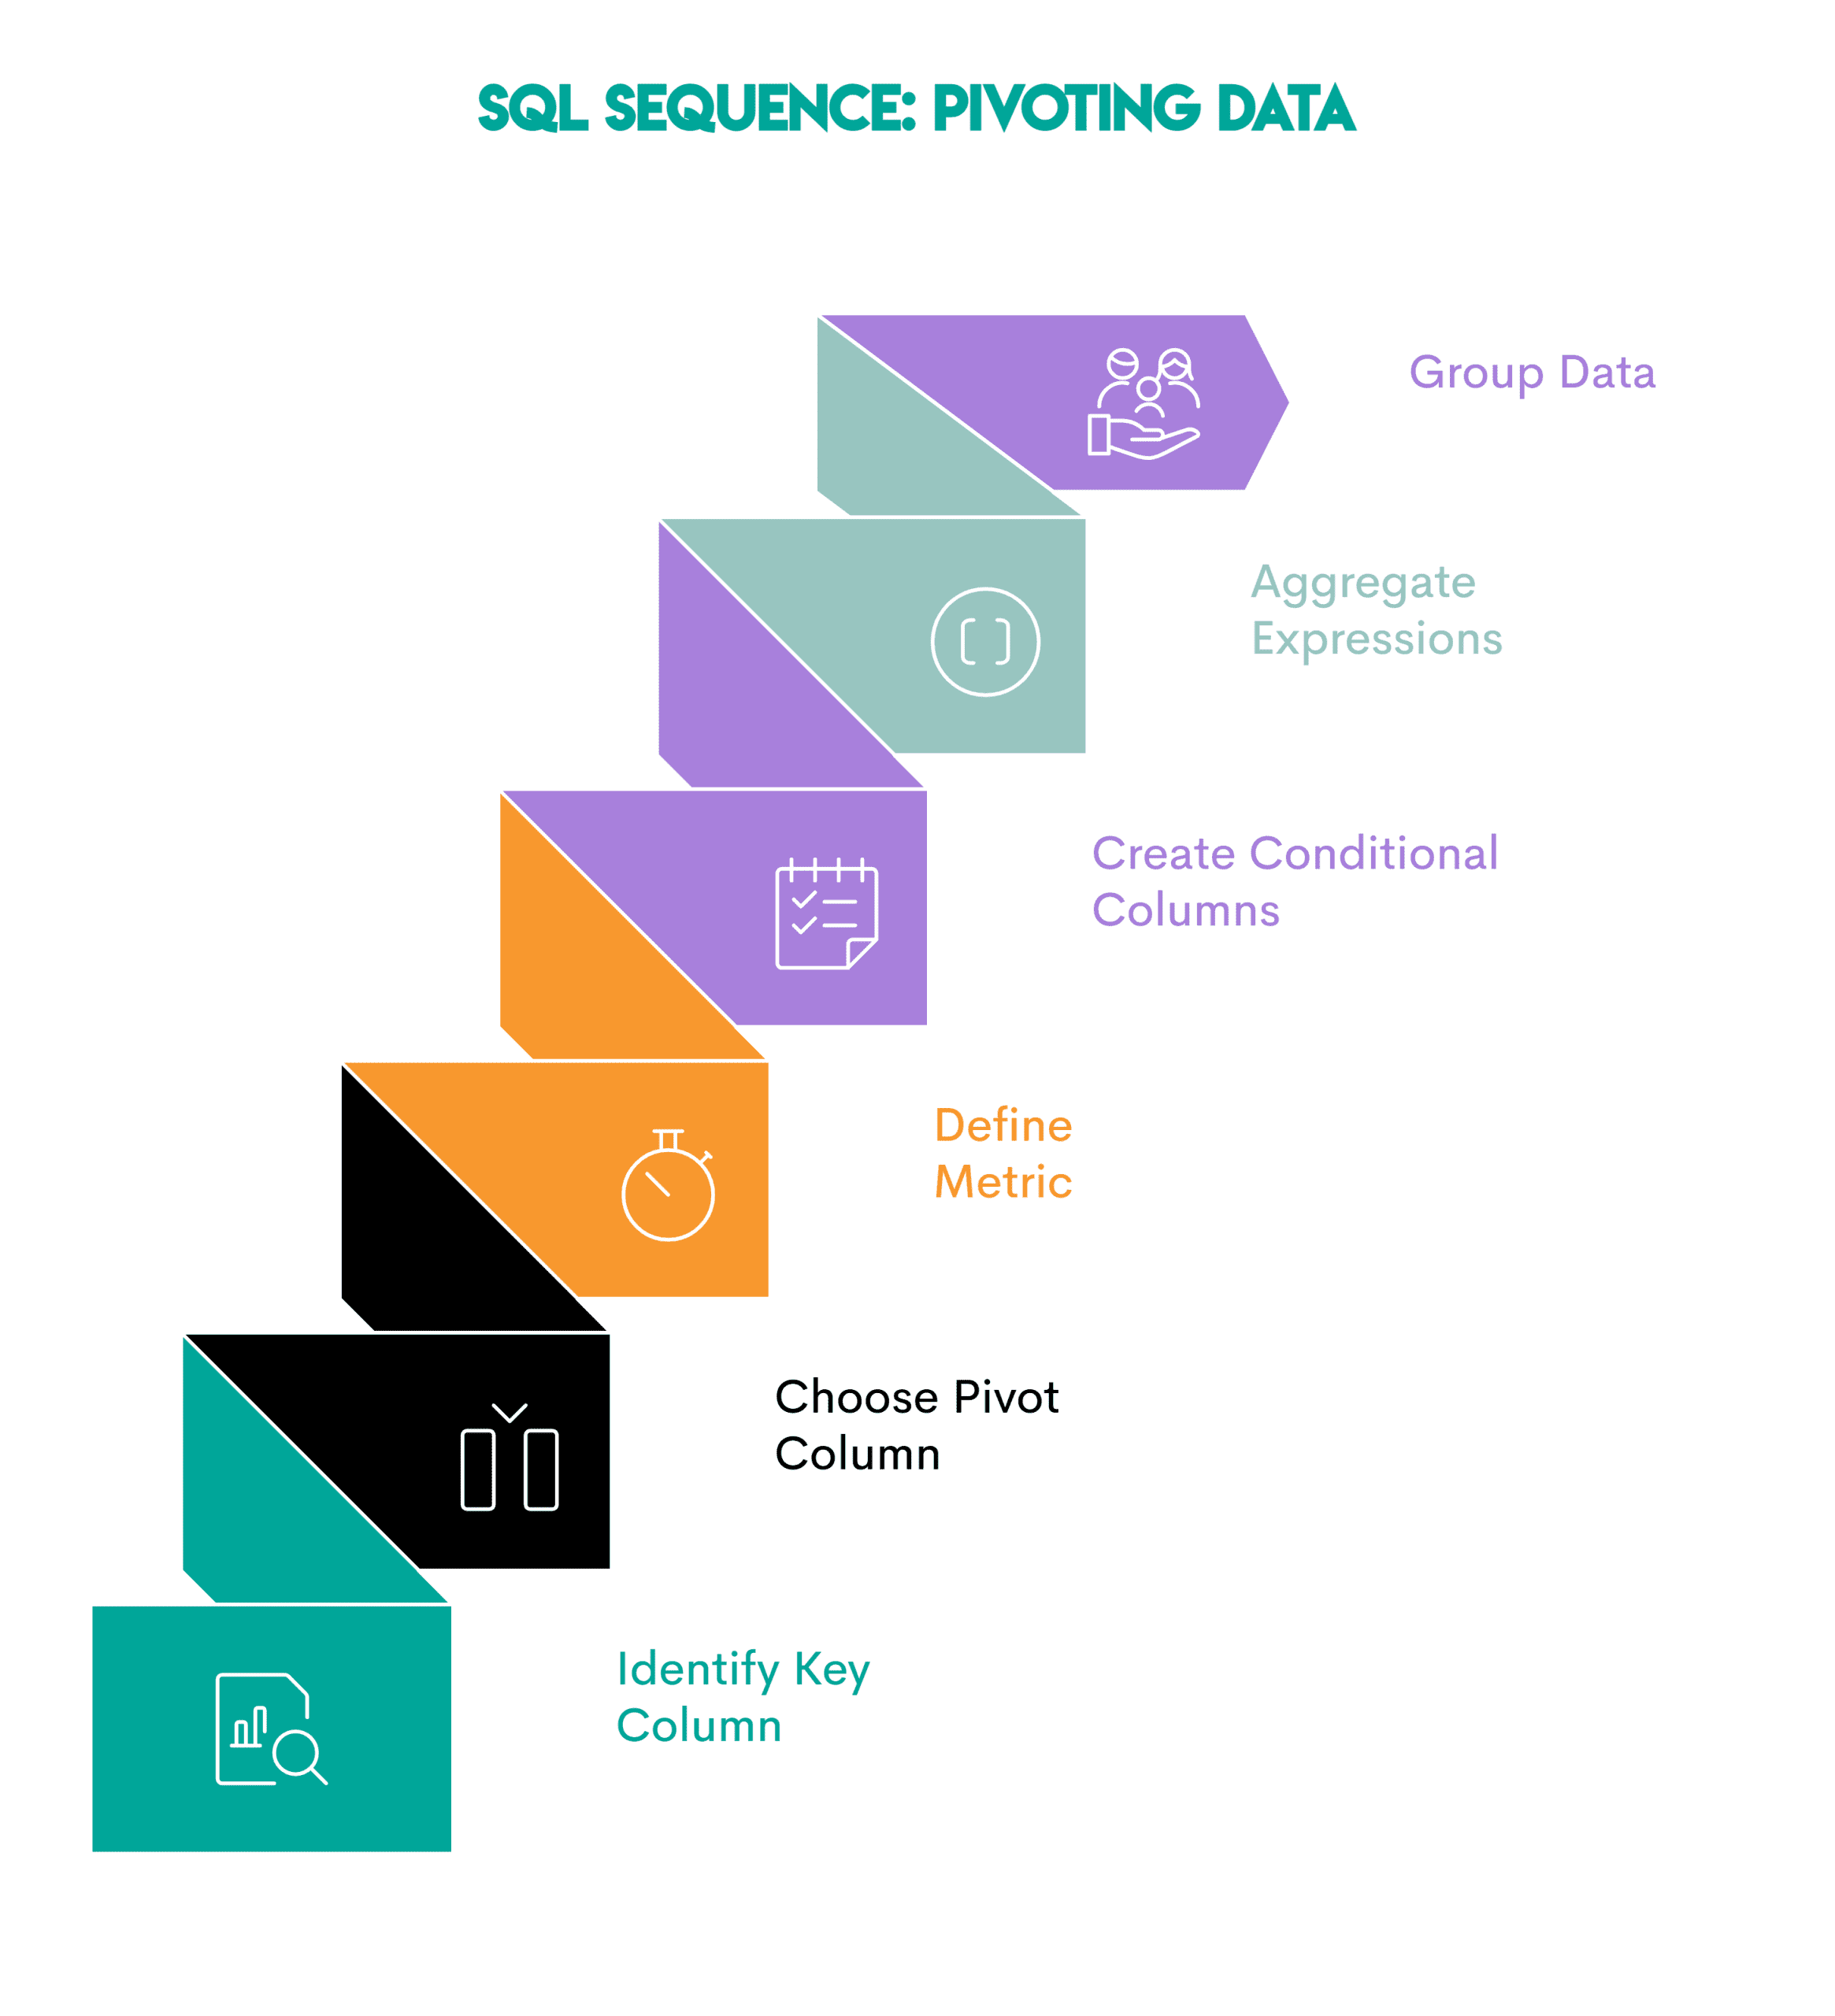
- Core Concept: Pivoting reshapes data by turning unique values from one column into new columns. This is often achieved using conditional aggregation with
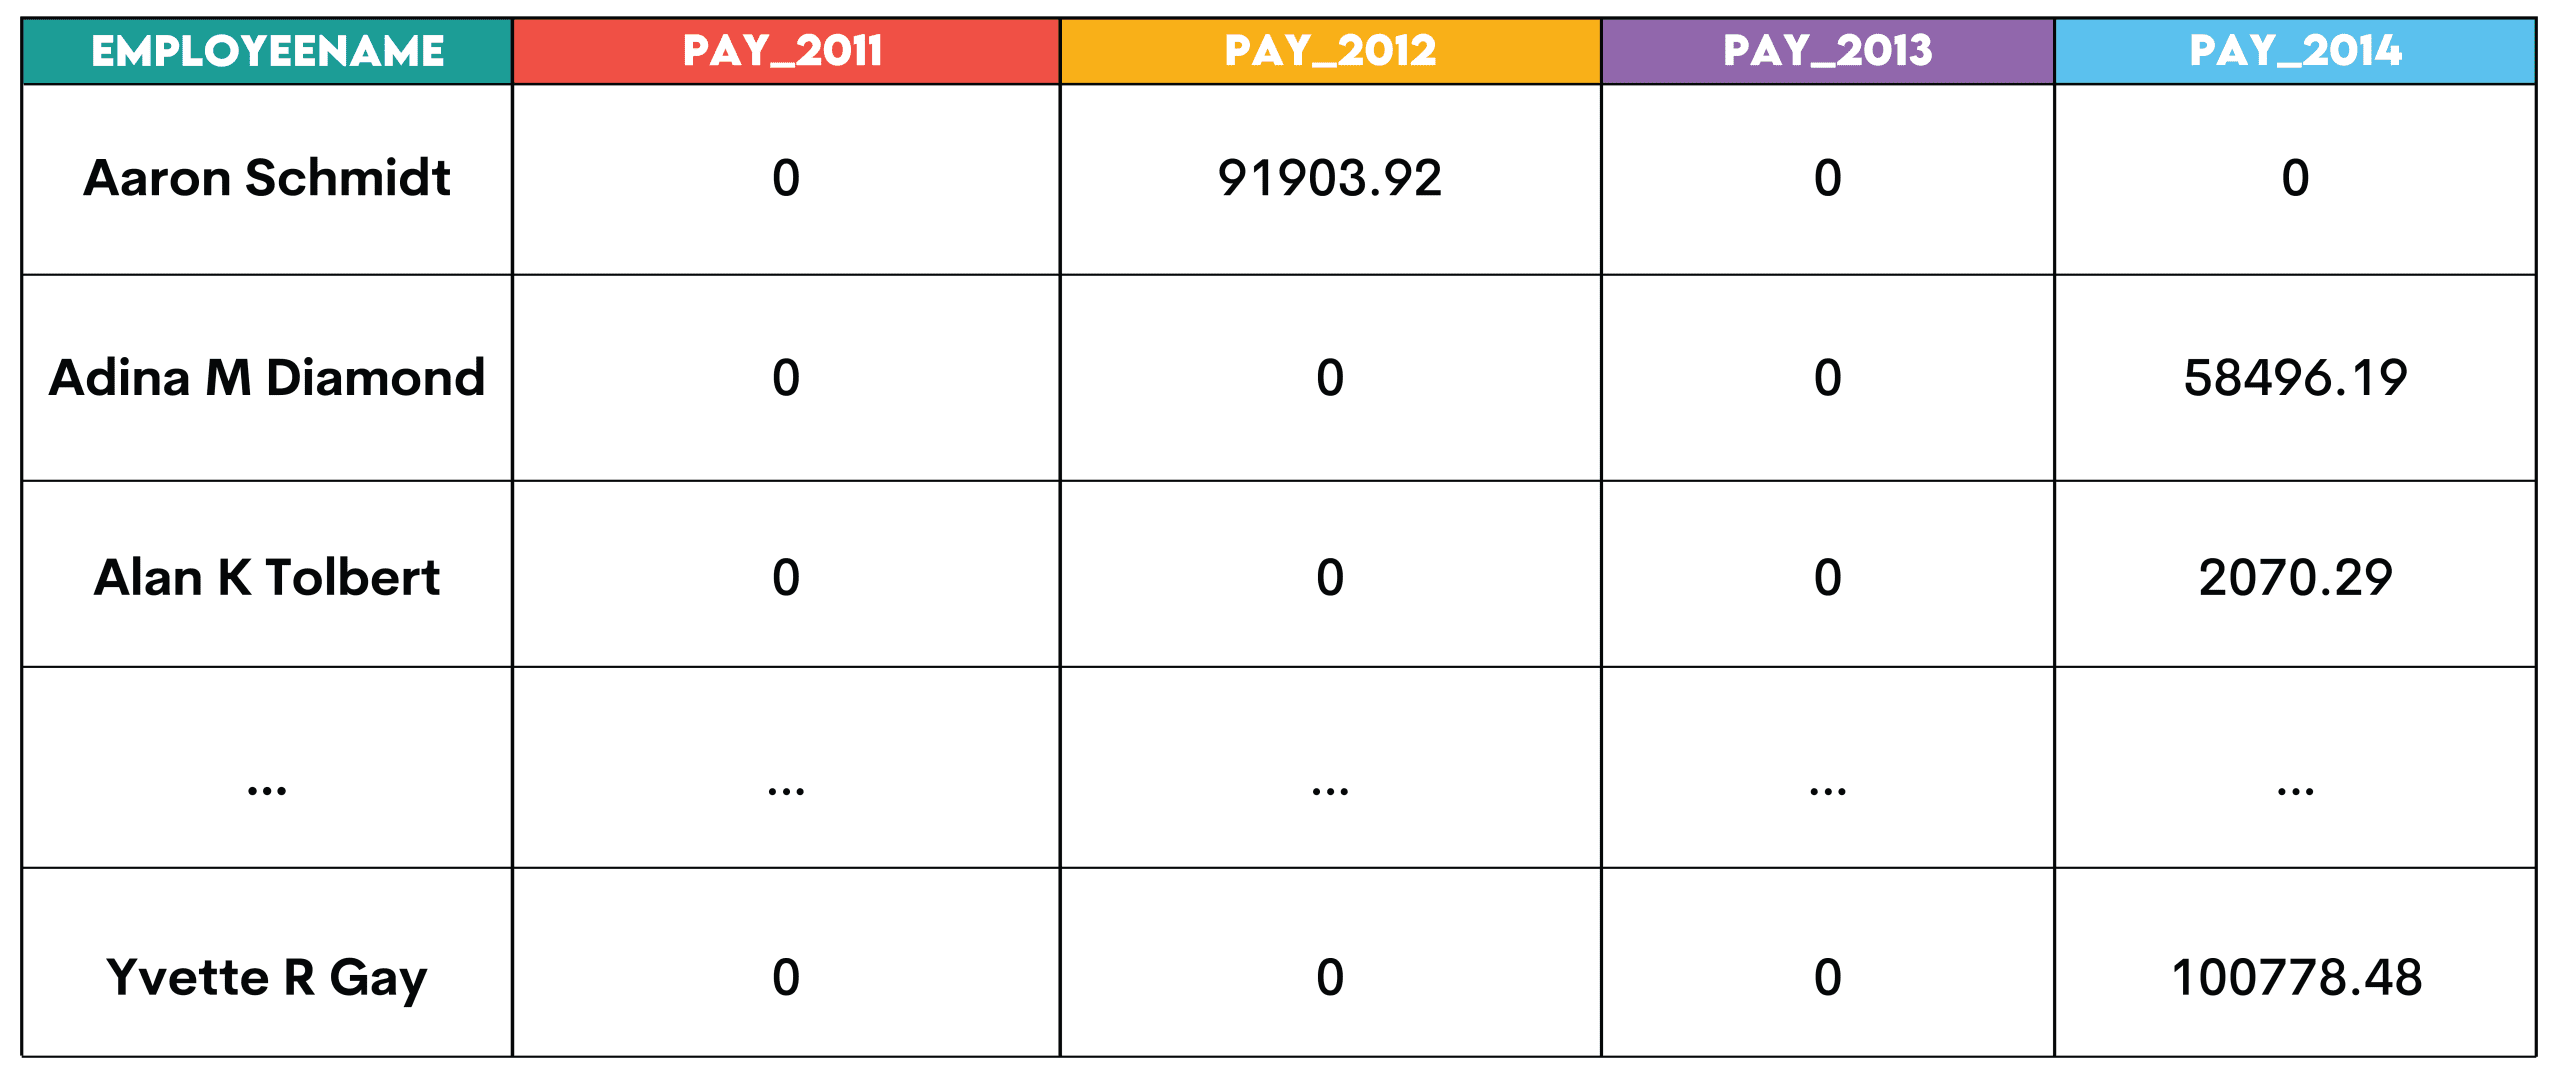
CASEstatements within an aggregate function, or dedicatedPIVOTclauses in some SQL dialects. - Real-World Application and Business Context: A city government, like San Francisco, might need to analyze employee salaries over several years. Instead of seeing multiple rows for a single employee’s annual pay, a pivot table could display each year (2011, 2012, 2013, 2014) as a separate column, with the employee’s name as the primary row identifier. This makes year-over-year comparisons for individual employees immediately apparent. Other business uses include comparing quarterly sales performance across different product lines, analyzing survey responses where each response option becomes a column, or comparing regional performance metrics side-by-side.
- Technical Deep Dive: While some database systems offer a
PIVOToperator, a common and highly portable method involves usingMAX()orSUM()withCASEexpressions. EachCASEstatement conditionally selects a value if it matches a specific criterion (e.g.,WHEN year = 2011 THEN totalpay ELSE 0 END), effectively creating a new column for that criterion. - Implications: Pivoting enhances data readability and facilitates direct comparisons, which is invaluable for strategic planning, performance reviews, and trend identification. It transforms complex datasets into intuitive summary tables, empowering stakeholders to quickly grasp comparative insights and leading to clearer presentations and faster analytical cycles.
5. Cumulative Metrics: Tracking Growth, Retention, and Progress Over Time
Understanding trends and progress often requires looking beyond individual data points to see the cumulative effect or a smoothed average over time.
- Core Concept: Cumulative metrics, such as running totals, moving averages, or running counts, provide insights into trends and progression rather than static snapshots. They typically utilize window functions with
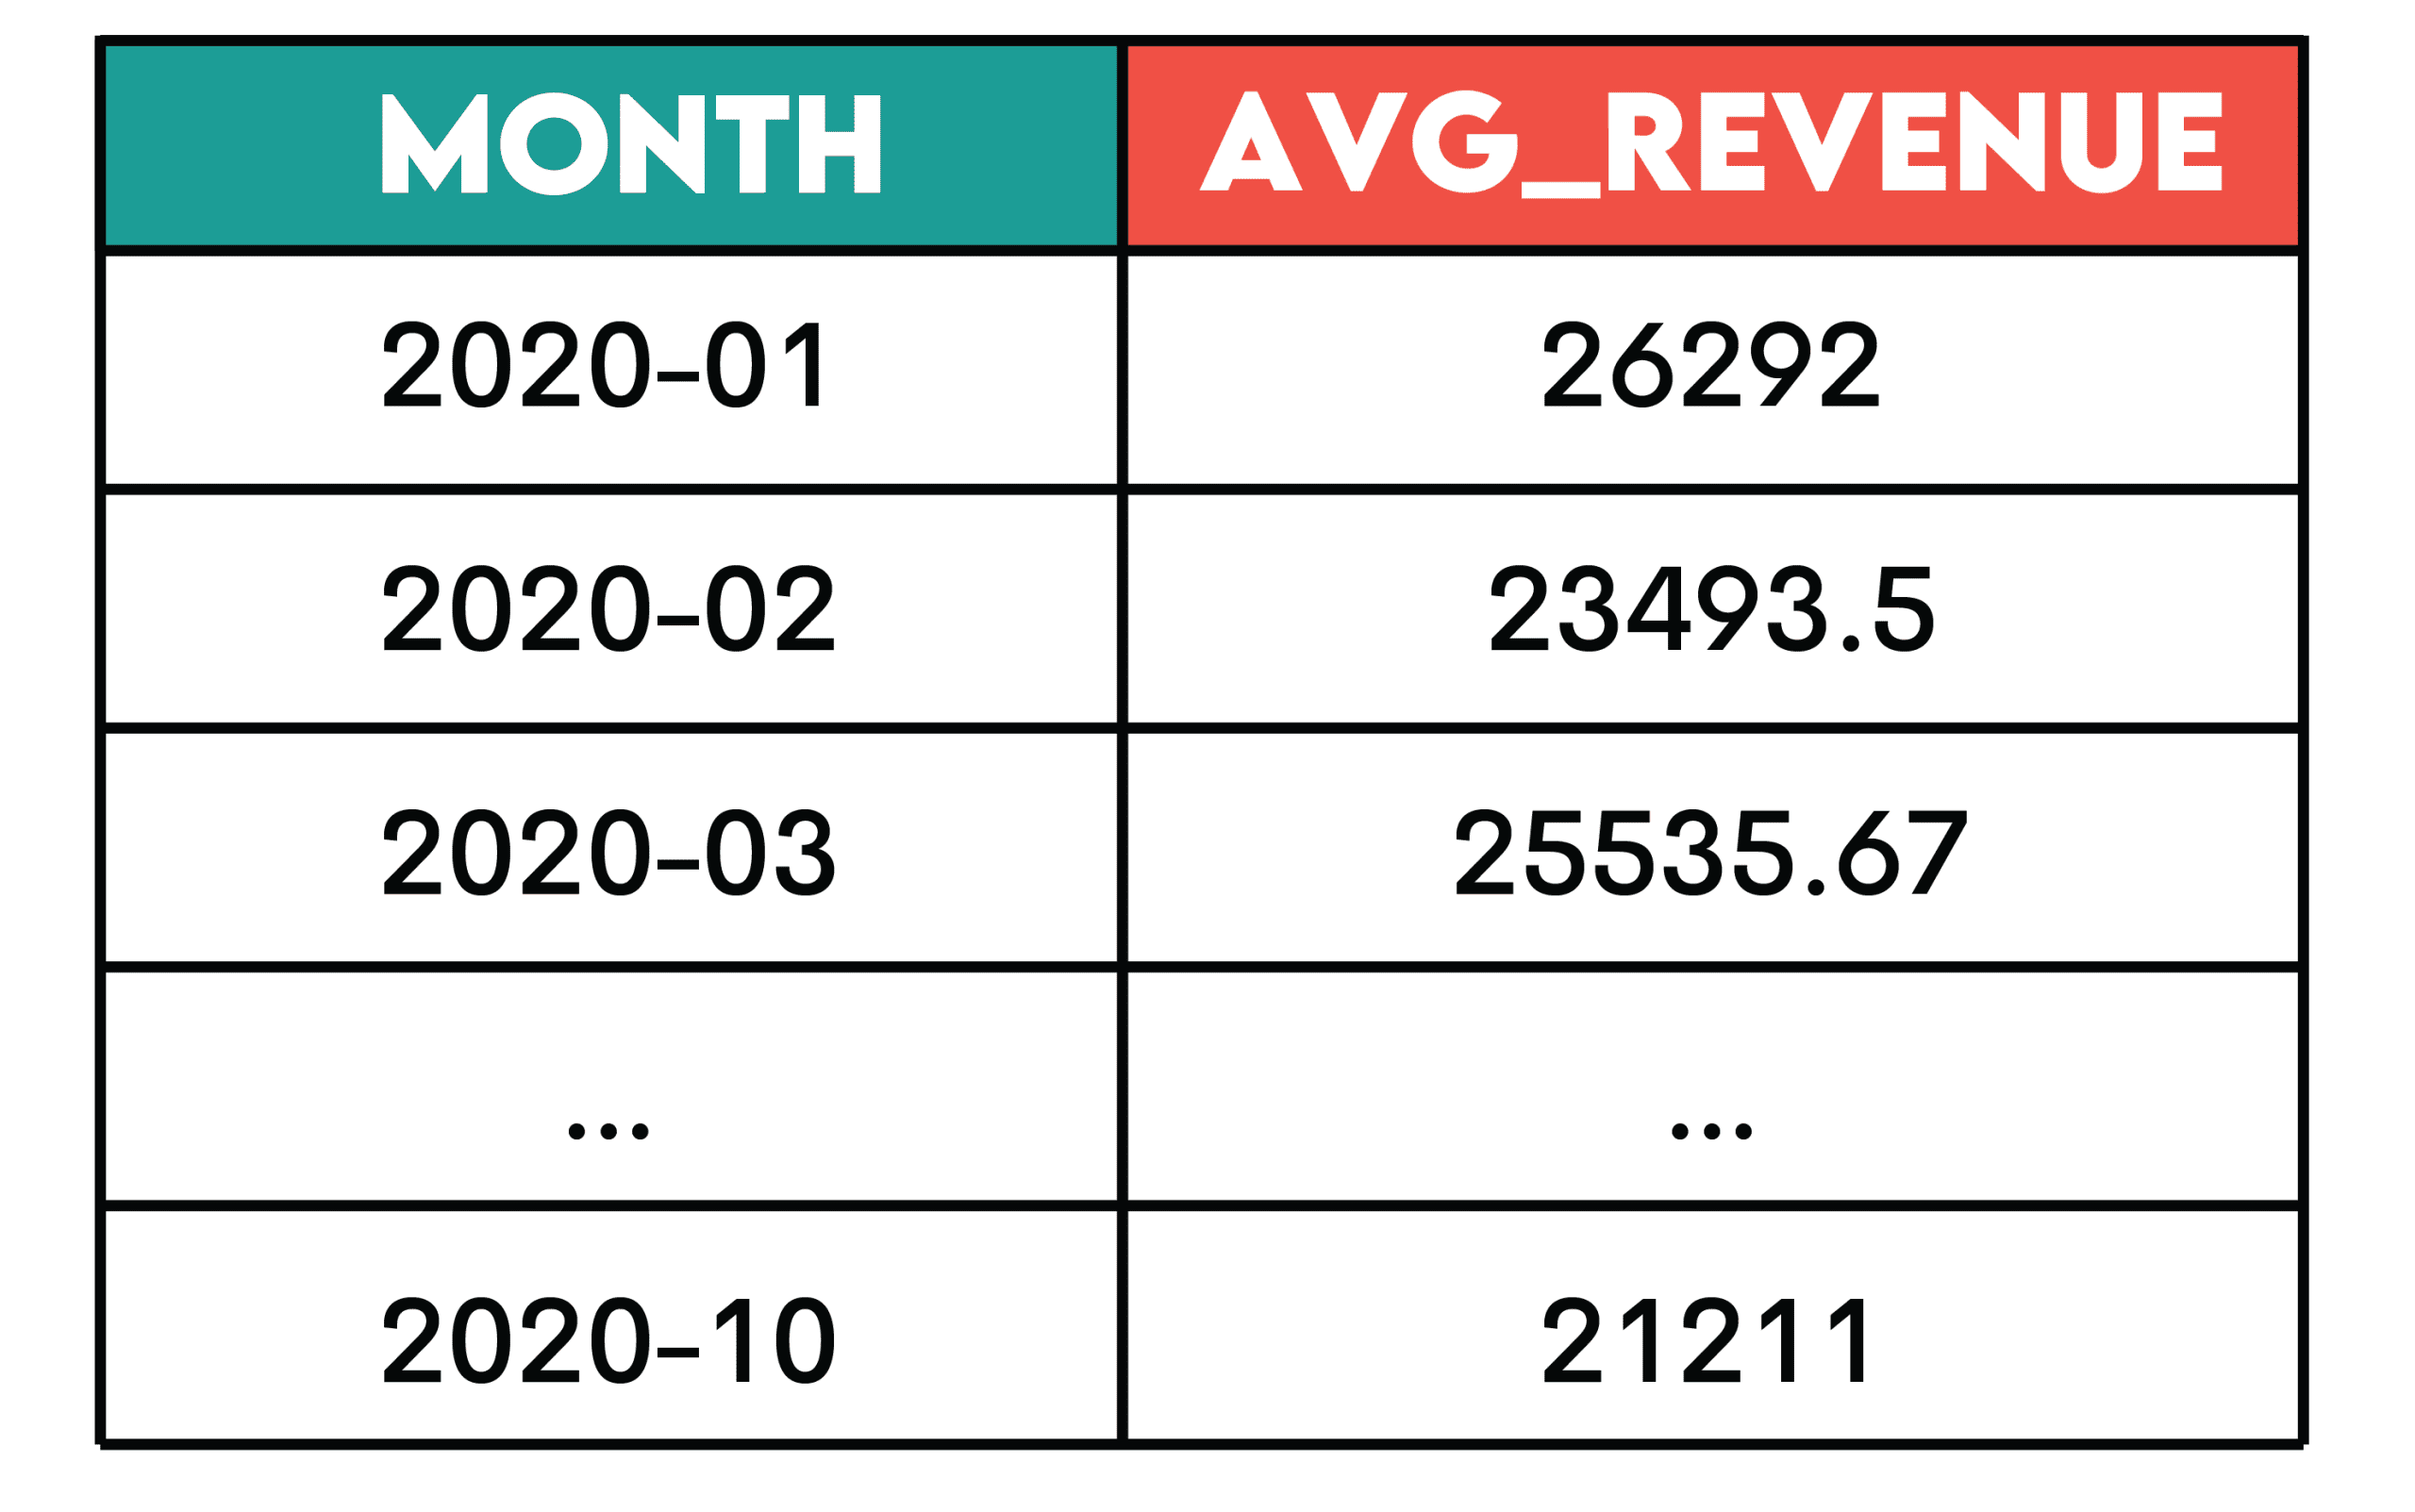
ROWS BETWEENclauses to define the range of rows included in the calculation. - Real-World Application and Business Context: For an e-commerce giant like Amazon, tracking "Revenue Over Time" is critical. A 3-month rolling average of monthly revenue, excluding returns (negative purchase values), can smooth out short-term fluctuations and reveal underlying growth trends. This is achieved by first calculating monthly revenue and then applying an
AVG()window function withROWS BETWEEN 2 PRECEDING AND CURRENT ROW. This pattern is vital for monitoring customer acquisition trends, assessing the progress of a project budget, tracking inventory levels over time, or understanding the long-term impact of marketing campaigns. It provides a more stable and reliable indicator of performance than raw monthly figures alone. - Technical Deep Dive: This pattern typically involves a subquery or Common Table Expression (CTE) to first aggregate data into discrete time periods (e.g., monthly revenue). Then, a window function (e.g.,
SUM() OVER (...)for running total,AVG() OVER (...)for moving average) is applied with aRANGEorROWSclause to specify the calculation window relative to the current row. - Implications: Cumulative metrics offer a dynamic view of performance, helping businesses identify long-term trends, forecast future outcomes, and make informed strategic adjustments. They are crucial for financial reporting, resource allocation, and understanding the health of recurring revenue models, providing a clearer picture of sustained growth or decline.
6. Funnel Analysis: Illuminating Sequential User Behavior
Understanding how users navigate through a series of predefined stages, from initial engagement to a desired conversion, is the domain of funnel analysis.
- Core Concept: Funnel analysis maps the user journey, measuring progression and identifying drop-off points between sequential stages. It typically involves multiple CTEs or subqueries, each representing a stage, and then
LEFT JOINoperations to connect users across these stages, allowing for calculation of conversion rates. - Real-World Application and Business Context: Spotify might perform a "Penetration Analysis" to measure how users progress through engagement stages: from initial activity to becoming a "power user" (e.g., 5+ sessions and 10+ listening hours). By defining each stage as a separate CTE and then performing
LEFT JOINoperations, the analysis can calculate how many users reach each stage and the overall conversion rate from the first activity to power user status, broken down by country. This pattern is fundamental for optimizing user onboarding flows in mobile apps, improving checkout processes on e-commerce sites, understanding lead qualification in sales funnels, or analyzing educational course completion rates. - Technical Deep Dive: This pattern often relies on identifying distinct users at each stage and then using
LEFT JOINoperations to sequentially link these stages. This allows for counting users who started a stage but did not complete the next, thus identifying drop-off rates. TheNULLIFfunction is also crucial for preventing division by zero when calculating conversion rates. - Implications: Funnel analysis is paramount for optimizing user experience, identifying friction points in a customer journey, and improving conversion rates. By pinpointing exactly where users disengage, businesses can implement targeted interventions, leading to significant improvements in key business metrics like sales, retention, and engagement, potentially boosting conversion rates by 15-25%.
7. Time-Based Comparison: Period-over-Period Metrics for Change Detection
To assess performance changes and identify anomalies or trends, comparing metrics across different time periods is essential.

- Core Concept: This pattern focuses on calculating the difference or ratio between a current period’s metric and a previous period’s metric. It often utilizes window functions like
LAG()orLEAD()to access values from preceding or succeeding rows within a sorted time series. - Real-World Application and Business Context: The City of San Francisco might analyze "Daily Violation Counts" to determine the change in the number of violations from one day to the next. By first grouping violations by inspection date and counting them, then applying
LAG(COUNT(violation_id))ordered by date, analysts can easily calculate the day-over-day difference. This pattern is crucial for monitoring sales variance from month to month, tracking website traffic fluctuations week-over-week, analyzing changes in customer support ticket volumes, or assessing the impact of policy changes by comparing pre- and post-implementation metrics. It provides immediate context for current performance. - Technical Deep Dive: The
LAG()andLEAD()window functions are central here, allowing access to data from a previous or subsequent row within a result set, defined by theORDER BYclause in theOVERstatement. This enables direct comparison of a metric with its historical counterpart without self-joins. - Implications: Time-based comparisons are indispensable for performance monitoring, anomaly detection, and understanding the velocity of change. They enable businesses to react swiftly to shifts in data, identify potential issues or opportunities, and make data-driven adjustments to strategies, often reducing response times to critical business events by 30%.
The Broader Impact of Pattern Recognition
Mastering these seven analytical patterns transcends mere technical proficiency; it fosters a deeper understanding of data’s inherent structures and the logical progression of analytical thought. For data scientists, this translates into:
- Increased Efficiency: Fewer unique solutions needed, leading to faster problem-solving.
- Enhanced Problem-Solving: A systematic approach to breaking down complex problems.
- Improved Communication: The ability to articulate analytical methodologies clearly to both technical and non-technical stakeholders.
- Career Advancement: Strong SQL and analytical pattern recognition are highly valued skills in the job market, frequently tested in interviews at leading technology companies.
Industry leaders consistently emphasize that a strong foundation in these patterns empowers data professionals to transition seamlessly between diverse projects and industries. It’s not just about writing SQL queries; it’s about thinking like an analyst, framing questions, and constructing robust data solutions that drive tangible business value.
Cultivating Analytical Mastery
For aspiring and current data scientists, internalizing these patterns requires consistent practice. Engaging with real-world datasets, tackling coding challenges (as offered by platforms like StrataScratch), and actively reflecting on the underlying pattern in each problem are key. Furthermore, understanding the business context behind each query elevates a data scientist from a mere coder to a strategic partner.
Wrapping Up
The notion that every data analysis problem is entirely unique is a misconception. By recognizing and applying these seven foundational patterns – Joins + Filters, Window Functions, Aggregation + Grouping, Pivoting, Cumulative Metrics, Funnel Analysis, and Time-Based Comparison – data scientists can demystify complex challenges. These patterns form the bedrock of robust data analysis, providing a universal toolkit applicable across industries and datasets. Mastering them not only streamlines the analytical process but also equips professionals with the critical thinking framework necessary to excel in the dynamic world of data science, enabling them to confidently tackle business situations and shine in competitive job interviews.


Leave a Reply