
A common scenario plays out in countless product development cycles: a new feature, a design tweak, or a pricing model is tested, showing promising metrics—an 8% uplift in conversions, glowing engagement numbers—only to falter disastrously in live production or quietly erode value months down the line. This recurring disappointment is not, as often assumed, a reflection of poor product ideas, but rather a glaring symptom of fundamental flaws within the experimentation practices themselves. The uncomfortable truth, increasingly acknowledged by industry leaders, is that the robust infrastructure and disciplined methodologies underpinning an A/B test often dictate its true efficacy far more than the variant being tested. Many organizations, despite significant investment in data-driven strategies, are inadvertently undermining their own efforts by overlooking critical pitfalls that transform apparent victories into costly strategic missteps.
The Rise of A/B Testing and Its Hidden Perils
A/B testing, a cornerstone of data-driven product development, has evolved from its origins in direct marketing to become an indispensable tool for tech giants and startups alike. In an era where user experience and incremental improvements can spell the difference between market leadership and obsolescence, the ability to empirically validate hypotheses before full-scale deployment is invaluable. Companies like Google, Amazon, and Netflix run thousands of experiments annually, leveraging them to refine everything from search algorithms to content recommendations. Yet, the very ubiquity of A/B testing has also exposed its vulnerabilities. The allure of quick wins can overshadow the complex statistical and operational rigor required, leading to a landscape where many "successful" tests are, in fact, built on shaky foundations.
A recent informal survey among data science professionals revealed that nearly 60% had encountered instances where a seemingly successful A/B test failed to deliver expected results in production. This discrepancy highlights a critical gap between the perceived reliability of experimental data and the reality of its implementation. The journey from a test variant to a deployed feature is fraught with potential pitfalls, from the initial setup and data collection to the final analysis and long-term monitoring. Understanding and mitigating these "silent killers" is paramount for any organization aiming to derive genuine, sustained value from its experimentation efforts.

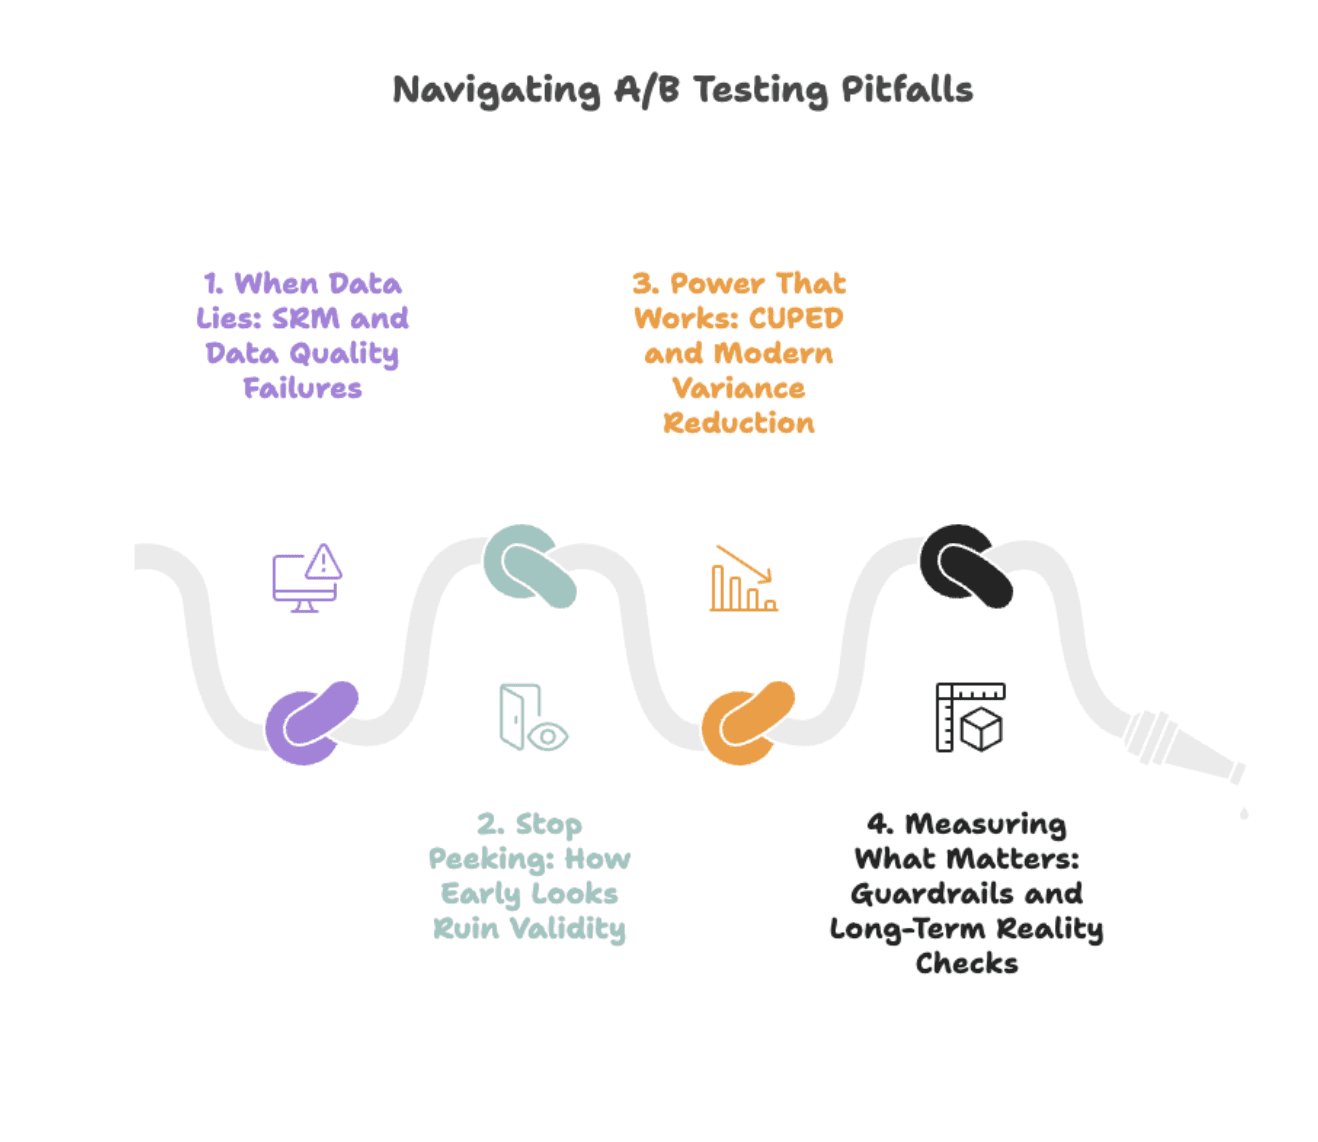
I. The Deceptive Data: Sample Ratio Mismatch and Quality Control
One of the most insidious threats to A/B test validity is the Sample Ratio Mismatch (SRM). At its core, an A/B test relies on the fundamental assumption of random assignment: users are randomly split into control and treatment groups, ensuring that any observed differences are attributable to the tested variant and not to pre-existing disparities between the groups. When you expect an even 50/50 split between two groups but observe, for instance, a 52/48 distribution, you have an SRM. This seemingly minor deviation is, in fact, a critical red flag – a "canary in the coal mine" signaling severe data quality issues that invalidate the entire experiment.
The implications of SRM are profound. A skewed ratio indicates a breakdown in the randomization process, which can stem from various sources:
- Broken Randomization Logic: Errors in the code that assigns users to groups.
- Biased Traffic Routing: Network or infrastructure issues directing more users from a specific segment (e.g., mobile users, users from a particular region) to one group.
- Logging Failures: Incomplete or differential data capture between groups, where events from one group are not recorded as reliably as the other.
- User ID Inconsistencies: Problems with how unique user identifiers are generated or persisted, leading to some users being counted multiple times or not at all in one group.
Industry giants have faced this challenge head-on. Microsoft, a pioneer in large-scale experimentation, has extensively documented how SRM signals severe data quality issues that often lead to incorrect shipping decisions. Their research emphasizes that experiments exhibiting SRM are frequently compromised, rendering any observed "wins" unreliable. Similarly, DoorDash encountered SRM when a bug fix disproportionately affected low-intent users, causing them to drop out of one experimental group. This skewed the sample, leading to a "phantom win" that would have been costly if deployed, as it masked a real underlying problem.
The solution to SRM is not statistical wizardry but meticulous data hygiene and immediate investigation. Before any metric analysis begins, teams must conduct SRM checks. If the test fails this ratio check, the experiment must be paused, investigated, and the underlying randomization or data capture issues resolved. As leading experimentation platforms like Optimizely and Statsig have demonstrated, automating these SRM checks with clear warning systems is crucial. Booking.com, known for its rigorous experimentation culture, mandates that data quality issues, especially SRM, be addressed before any results are considered. This non-negotiable approach ensures that the foundation of every test is sound, preventing the costly error of building strategies on misleading data. Ignoring SRM is akin to building a house on quicksand; the structure, no matter how well-designed, is destined to collapse.
II. The Pitfall of Premature Peeking: How Early Looks Skew Results
The human desire for quick answers and positive outcomes often clashes with statistical rigor, particularly in the context of A/B testing. The temptation to "peek" at test results daily or even hourly, especially when a promising trend emerges, is strong. However, this seemingly innocuous act of checking progress systematically inflates the false positive rate, leading teams to declare "wins" that are merely products of random chance.
This phenomenon is rooted in the multiple comparisons problem. Every time a statistical test is performed, there’s a small probability (typically 5% for a p-value of 0.05) of observing a statistically significant result purely by chance, even if there’s no real effect. When you continuously monitor an experiment and decide to stop based on an arbitrary threshold of significance, you’re essentially giving randomness multiple opportunities to "trick" you. Optimizely’s seminal research on this topic found that uncorrected peeking can dramatically increase the false positive rate from the standard 5% to over 25%. This means that one in four "successful" tests might actually be noise, not a true signal.
A naive approach to A/B testing often involves:
- Daily Dashboard Checks: Monitoring p-values and confidence intervals every morning.
- Stopping Early on "Significance": Halting a test as soon as a p-value drops below 0.05, even if the predetermined sample size hasn’t been reached.
- Ignoring Pre-calculated Durations: Disregarding initial power analyses that dictate the minimum required test length to detect a meaningful effect.
The antidote to premature peeking lies in disciplined adherence to predefined stopping rules and the adoption of advanced statistical methodologies. Sequential testing, a technique employed by sophisticated experimentation platforms like Amplitude and Optimizely, adjusts for the multiple looks problem. These methods use always-valid inference techniques that allow for continuous monitoring while maintaining the integrity of the false positive rate. They achieve this by dynamically adjusting the significance thresholds as more data accumulates.
A foundational best practice is to predefine the experiment’s duration and sample size based on a power analysis before the test begins. This ensures that the test has sufficient statistical power to detect a minimum detectable effect with a desired level of confidence. Deviating from this plan without using methods designed for sequential analysis turns the experiment into a statistical gamble. As one leading data scientist quipped, "Stop when it looks good isn’t a rule; it’s a recipe for fool’s gold." The pressure to deliver results quickly is understandable, but sacrificing statistical validity for perceived speed ultimately leads to slower, more costly progress through false starts and erroneous deployments.
III. Maximizing Experiment Efficiency: The Power of Variance Reduction
In the quest for reliable A/B test results, simply running longer tests or funneling more traffic isn’t always the most efficient answer. Many key business metrics, such as user revenue, time spent, or conversion value, inherently exhibit high variability. This "noise" can obscure the true effect of a tested variant, demanding extremely large sample sizes or extended test durations to achieve statistical significance. This consumes valuable experimentation capacity, slows down learning, and can delay product improvements.
Enter Controlled-experiment Using Pre-Experiment Data (CUPED), a powerful variance reduction technique pioneered by Microsoft. The core concept behind CUPED is to leverage users’ pre-experiment behavior to predict their post-experiment outcomes. By statistically controlling for this pre-existing variance, CUPED effectively "removes" the predictable noise, allowing the experiment to more clearly isolate and measure the actual treatment effect. This shrinks confidence intervals without the need to collect more data, making experiments more sensitive and efficient.
The impact of CUPED is substantial. Microsoft reported that for some product teams, implementing CUPED was akin to adding 20% more traffic to their experiments, enabling faster iteration and detection of smaller effects. Netflix observed variance reductions of approximately 40% on critical engagement metrics, dramatically shortening the time required to reach significance. Statsig, an experimentation platform provider, has seen CUPED reduce variance by 50% or more for many common metrics, meaning tests can reach significance in half the time or with half the traffic.

The mechanism is straightforward:
Adjusted_metric = Raw_metric - Θ × (Pre_period_metric - Mean_pre_period)
In simpler terms, if a user typically spent $100 per week before the test, and your test group generally averaged $90 per week pre-test, CUPED adjusts downward for users who were already high spenders. This ensures you’re measuring the true impact of the treatment, not simply pre-existing user behavior differences.
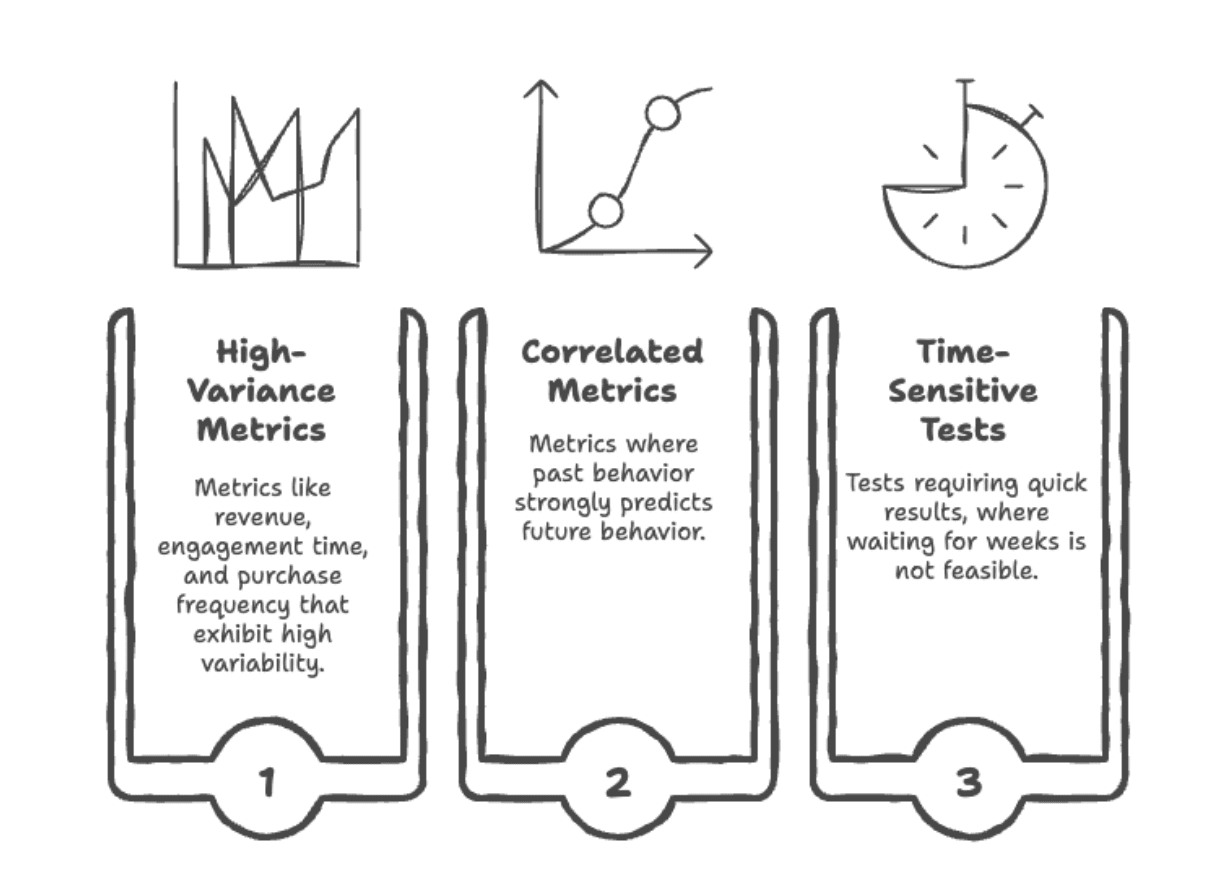
CUPED is particularly effective when:
- Pre-experiment data is highly correlated with the metric of interest: For example, using previous purchase history to predict future spending.
- The metric has high natural variance: Such as revenue, session duration, or number of actions.
- Experiments need to run faster or with less traffic: When resources are constrained or time-to-market is critical.
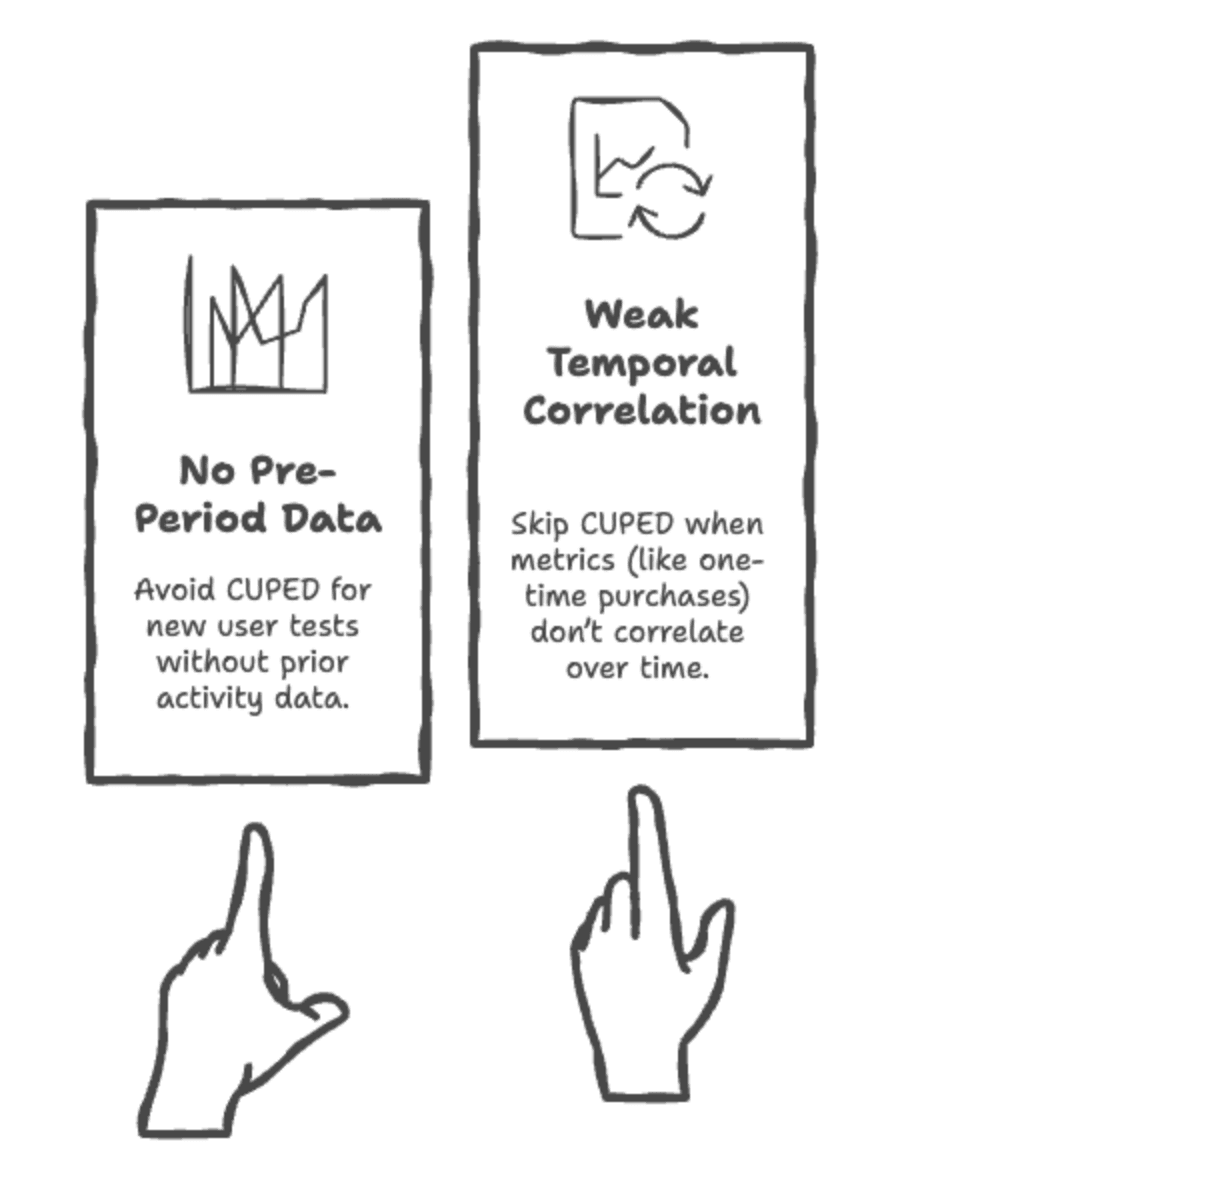
However, CUPED may not be suitable when:
- There’s no relevant pre-experiment data: For completely new users or products.
- The pre-experiment data is not correlated with the post-experiment metric: If past behavior doesn’t predict future behavior in the context of the experiment.
- The metric itself is an anomaly or a one-off event: Where historical context provides little predictive power.
Newer methods like CUPAC (combining covariates across metrics) and stratified sampling further enhance variance reduction, but the underlying principle remains consistent: proactively reduce noise before analysis to gain clearer, faster insights. Most modern experimentation platforms (Optimizely, Eppo, GrowthBook) now support CUPED out of the box, making it accessible even for teams without deep statistical expertise. For those rolling their own solutions, integrating pre-period covariates into the analysis pipeline offers significant statistical lift for a manageable engineering effort.
IV. Beyond the Obvious: Guardrail Metrics and Long-Term Validation
A pervasive pitfall in A/B testing is optimizing for a narrow, immediate metric without considering its broader impact or long-term consequences. A classic scenario involves a feature that boosts clicks by 12%. Jubilant, the team ships it. Three months later, user retention has mysteriously dropped by 8%. What happened? The team optimized a "vanity metric" – clicks – without adequately protecting against downstream harm to more critical business objectives.
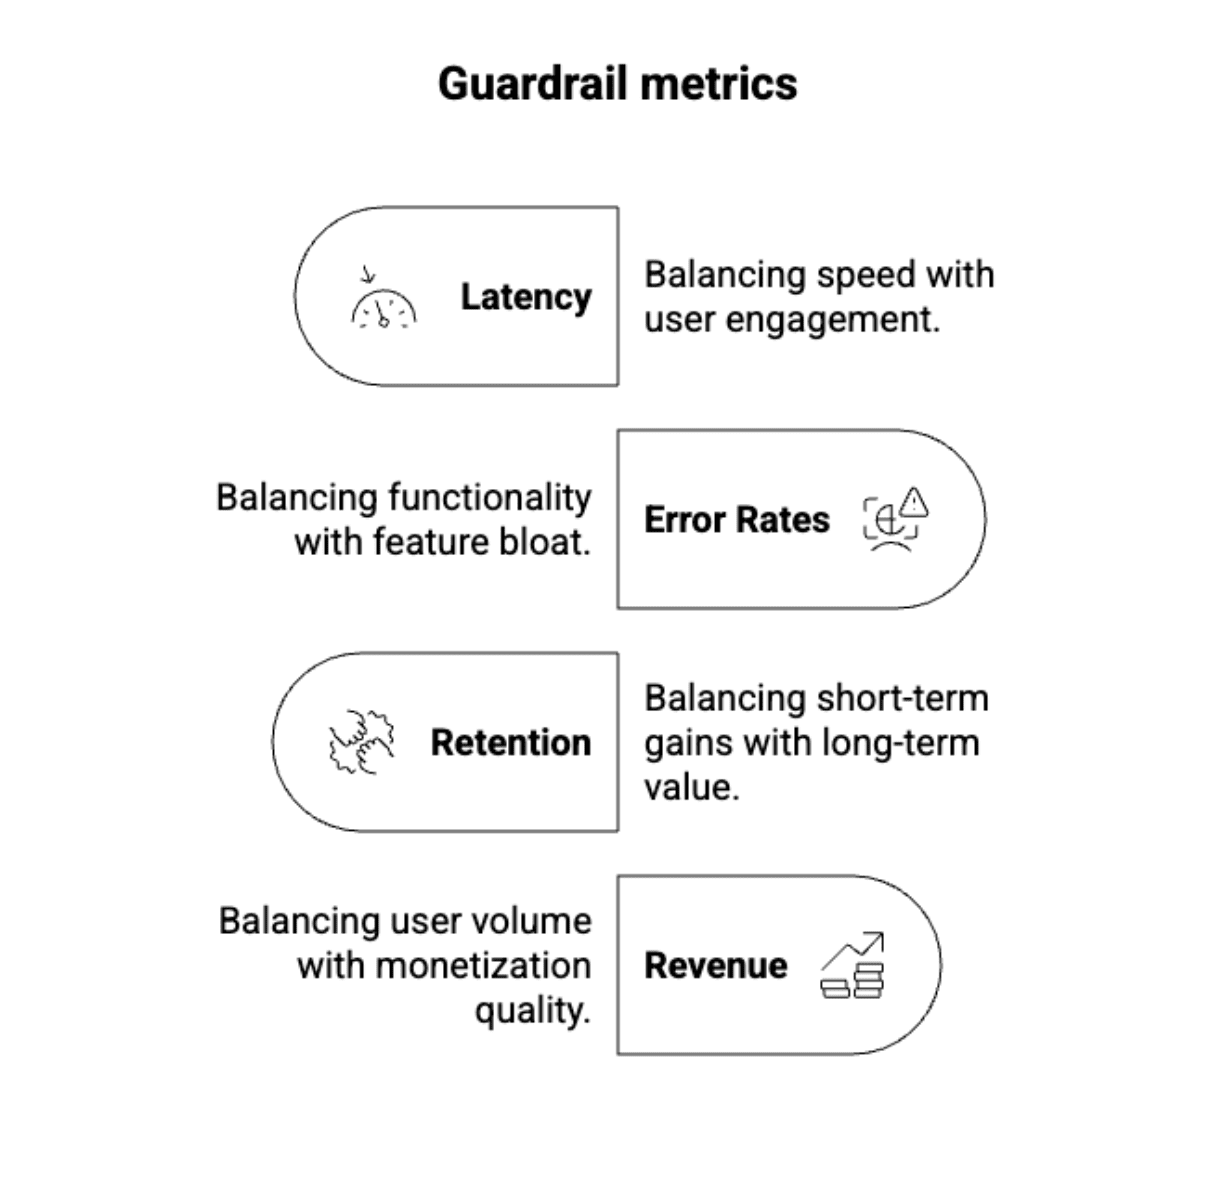
The solution lies in a robust framework of guardrail metrics. These are not the primary metrics an experiment aims to optimize but rather a set of crucial indicators monitored to detect unintended negative consequences. They act as a safety net, ensuring that short-term gains don’t come at the expense of long-term health. Guardrails can encompass:
- User Experience: Customer satisfaction scores, support contact rates, reported bugs.
- System Performance: Latency, error rates, page load times.
- Financial Health: Average revenue per user (ARPU), lifetime value (LTV), cost per acquisition (CPA).
- Brand Perception: Net Promoter Score (NPS), social media sentiment.
Airbnb, a company renowned for its sophisticated experimentation culture, provides a compelling real-world example. They discovered that a test designed to increase bookings inadvertently led to a decrease in review ratings. While the change attracted more users, it ultimately hurt long-term host and guest satisfaction. Guardrail metrics, specifically review scores, flagged this problem before a full rollout could cause significant damage. Airbnb’s system of guardrails proactively flags approximately 25 experiments monthly for stakeholder review, preventing an estimated five potentially major negative impacts from reaching their users.
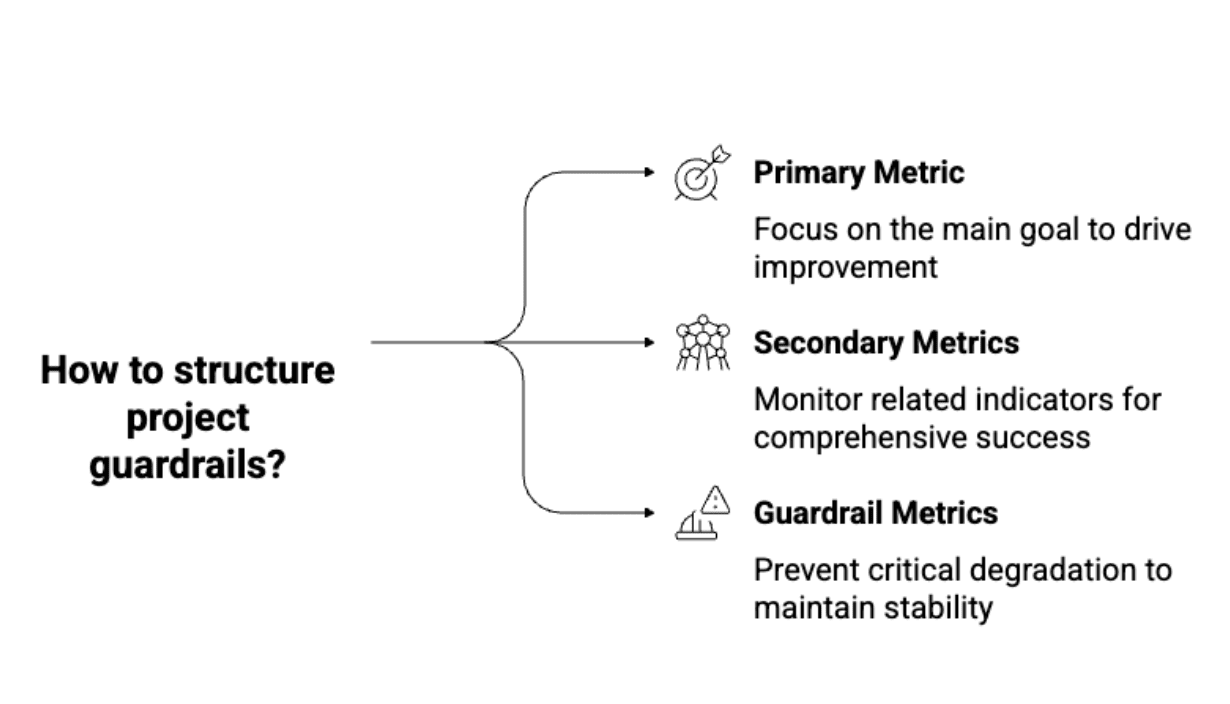
Structuring guardrails involves:
- Pre-defining a comprehensive set: Beyond the primary metric, identify all key business and user health indicators.
- Setting clear thresholds: Establish acceptable ranges for each guardrail. A deviation beyond these thresholds warrants immediate investigation, even if the primary metric is positive.
- Automated monitoring: Integrate guardrail checks into the experimentation platform, providing real-time alerts.
Beyond immediate guardrails, the "novelty problem" poses another challenge. Users often engage with new features simply because they are novel, not because they are inherently better. A new button might get more clicks initially, but if the underlying value isn’t there, engagement will quickly revert or decline. Short-term A/B tests often capture these novelty effects, leading to misleading "wins."
To combat this, companies employ holdout groups. These are small, carefully selected segments of users (typically 5-10%) who are deliberately kept on the pre-change experience for an extended period after a feature is launched. By continuously monitoring the long-term metrics of these holdout groups against the deployed variant, organizations can measure whether the effects observed in the initial test persist over weeks or months. If the positive effect disappears in the holdout analysis, it wasn’t a real win; it was curiosity. This multi-phase validation process ensures that only truly beneficial changes are integrated into the product, contributing to sustainable growth and user satisfaction.
Industry Leaders Set the Standard: A Blueprint for Rigorous Experimentation
The gap between merely running A/B tests and extracting profound, actionable insights lies not in statistical esotericism, but in operational discipline and a commitment to rigor. Leading experimentation teams at companies like Booking.com, Netflix, and Microsoft have established a blueprint for success that transcends individual statistical techniques:
-
Automating SRM Checks: Modern experimentation platforms like Optimizely and Statsig have moved beyond manual SRM checks. They automatically run these tests on every experiment, displaying prominent warnings if a mismatch is detected. Critically, these systems often lack an override option, forcing teams to address data quality issues before proceeding. Booking.com’s culture, for example, treats SRM checks as non-negotiable gates, ensuring data integrity is paramount. This proactive, automated approach prevents flawed experiments from ever reaching the analysis stage.
-
Pre-Registering Metrics: To prevent "p-hacking" (selectively reporting metrics that show significance) and to ensure experiments are hypothesis-driven, top teams rigorously define primary, secondary, and guardrail metrics before the test begins. Netflix’s experimentation protocol, for instance, requires teams to articulate their core hypothesis and the precise metrics they intend to influence and monitor. This discipline prevents post-hoc metric mining and ensures that claimed "wins" are genuinely tied to the initial research question, fostering transparency and accountability.
-
Running Postmortems for Every Launch: Microsoft’s ExP platform mandates postmortems for every shipped experiment, regardless of whether it was a win or a loss. This isn’t bureaucracy; it’s a critical learning infrastructure. These reviews delve into:
- Hypothesis vs. Result: Did the outcome align with the initial prediction?
- Unexpected Learnings: What surprising insights emerged, even if the primary hypothesis failed?
- Process Improvements: Were there any issues in setup, data collection, or analysis that can be improved for future experiments?
- Future Actions: What are the next steps based on the learnings?
This systematic reflection cultivates a culture of continuous improvement, turning every experiment into a valuable learning opportunity.
-
Experimenting at Scale with Learning as the Core Metric: Companies like Booking.com, running over 1,000 concurrent experiments, understand a fundamental truth: most tests (often 90% or more) will "fail" to show a significant positive impact. The goal isn’t a high "win rate" but a high "learning rate." Teams are measured not on the number of features shipped or positive results, but on:
- Experiment Velocity: How quickly new ideas can be tested.
- Depth of Learnings: The quality and actionable nature of insights derived.
- Rigor of Execution: Adherence to best practices and data integrity.
This shifts the focus from vanity metrics to genuine knowledge acquisition, discouraging gaming the system and rewarding rigorous execution.
-
Building a Centralized Experimentation Platform: Great teams do not allow individual engineers to roll their own ad-hoc A/B tests. They invest in (or build) a centralized experimentation platform that standardizes and automates best practices. Such platforms:
- Enforce Randomization and SRM Checks: Ensuring data quality from the outset.
- Integrate Variance Reduction Techniques: Making CUPED and similar methods easily accessible.
- Automate Statistical Analysis: Providing reliable p-values, confidence intervals, and sequential testing capabilities.
- Provide Centralized Metric Definitions: Ensuring consistency across all experiments.
This democratizes access to robust experimentation, reduces engineering overhead, and ensures that rigor is embedded into the very infrastructure, making trustworthy testing the default.
The Broader Impact: Cultivating a Culture of Trustworthy Data
The hardest truth in A/B testing is not statistical; it’s cultural. Mastering advanced statistical methods, implementing sophisticated variance reduction techniques, and defining comprehensive guardrails are all crucial, but none of it matters if a team checks results prematurely, ignores SRM warnings, or ships perceived wins without proper long-term validation. The organizational impact of flawed experimentation is profound: it erodes trust in data, leads to wasted development cycles, misallocates resources, and ultimately stifles genuine innovation.
Organizations that embrace automated rigor, enforced discipline, and a shared agreement that "it looked significant" is never good enough are the ones that truly scale experimentation. They foster a culture where data integrity is paramount, learning from failures is celebrated, and every decision is grounded in empirically validated insights. This commitment translates into faster product cycles, more confident strategic decisions, and a sustainable competitive advantage.
In an increasingly data-saturated world, the ability to discern true signals from noise is a strategic imperative. The next time a seemingly winning test emerges, or the temptation arises to bypass a critical check, remember: the most expensive mistake in experimentation is convincing oneself the data is clean when it is not. Investing in the infrastructure, processes, and culture of rigorous A/B testing is not just about avoiding pitfalls; it’s about unlocking the full potential of data-driven innovation.


Leave a Reply