
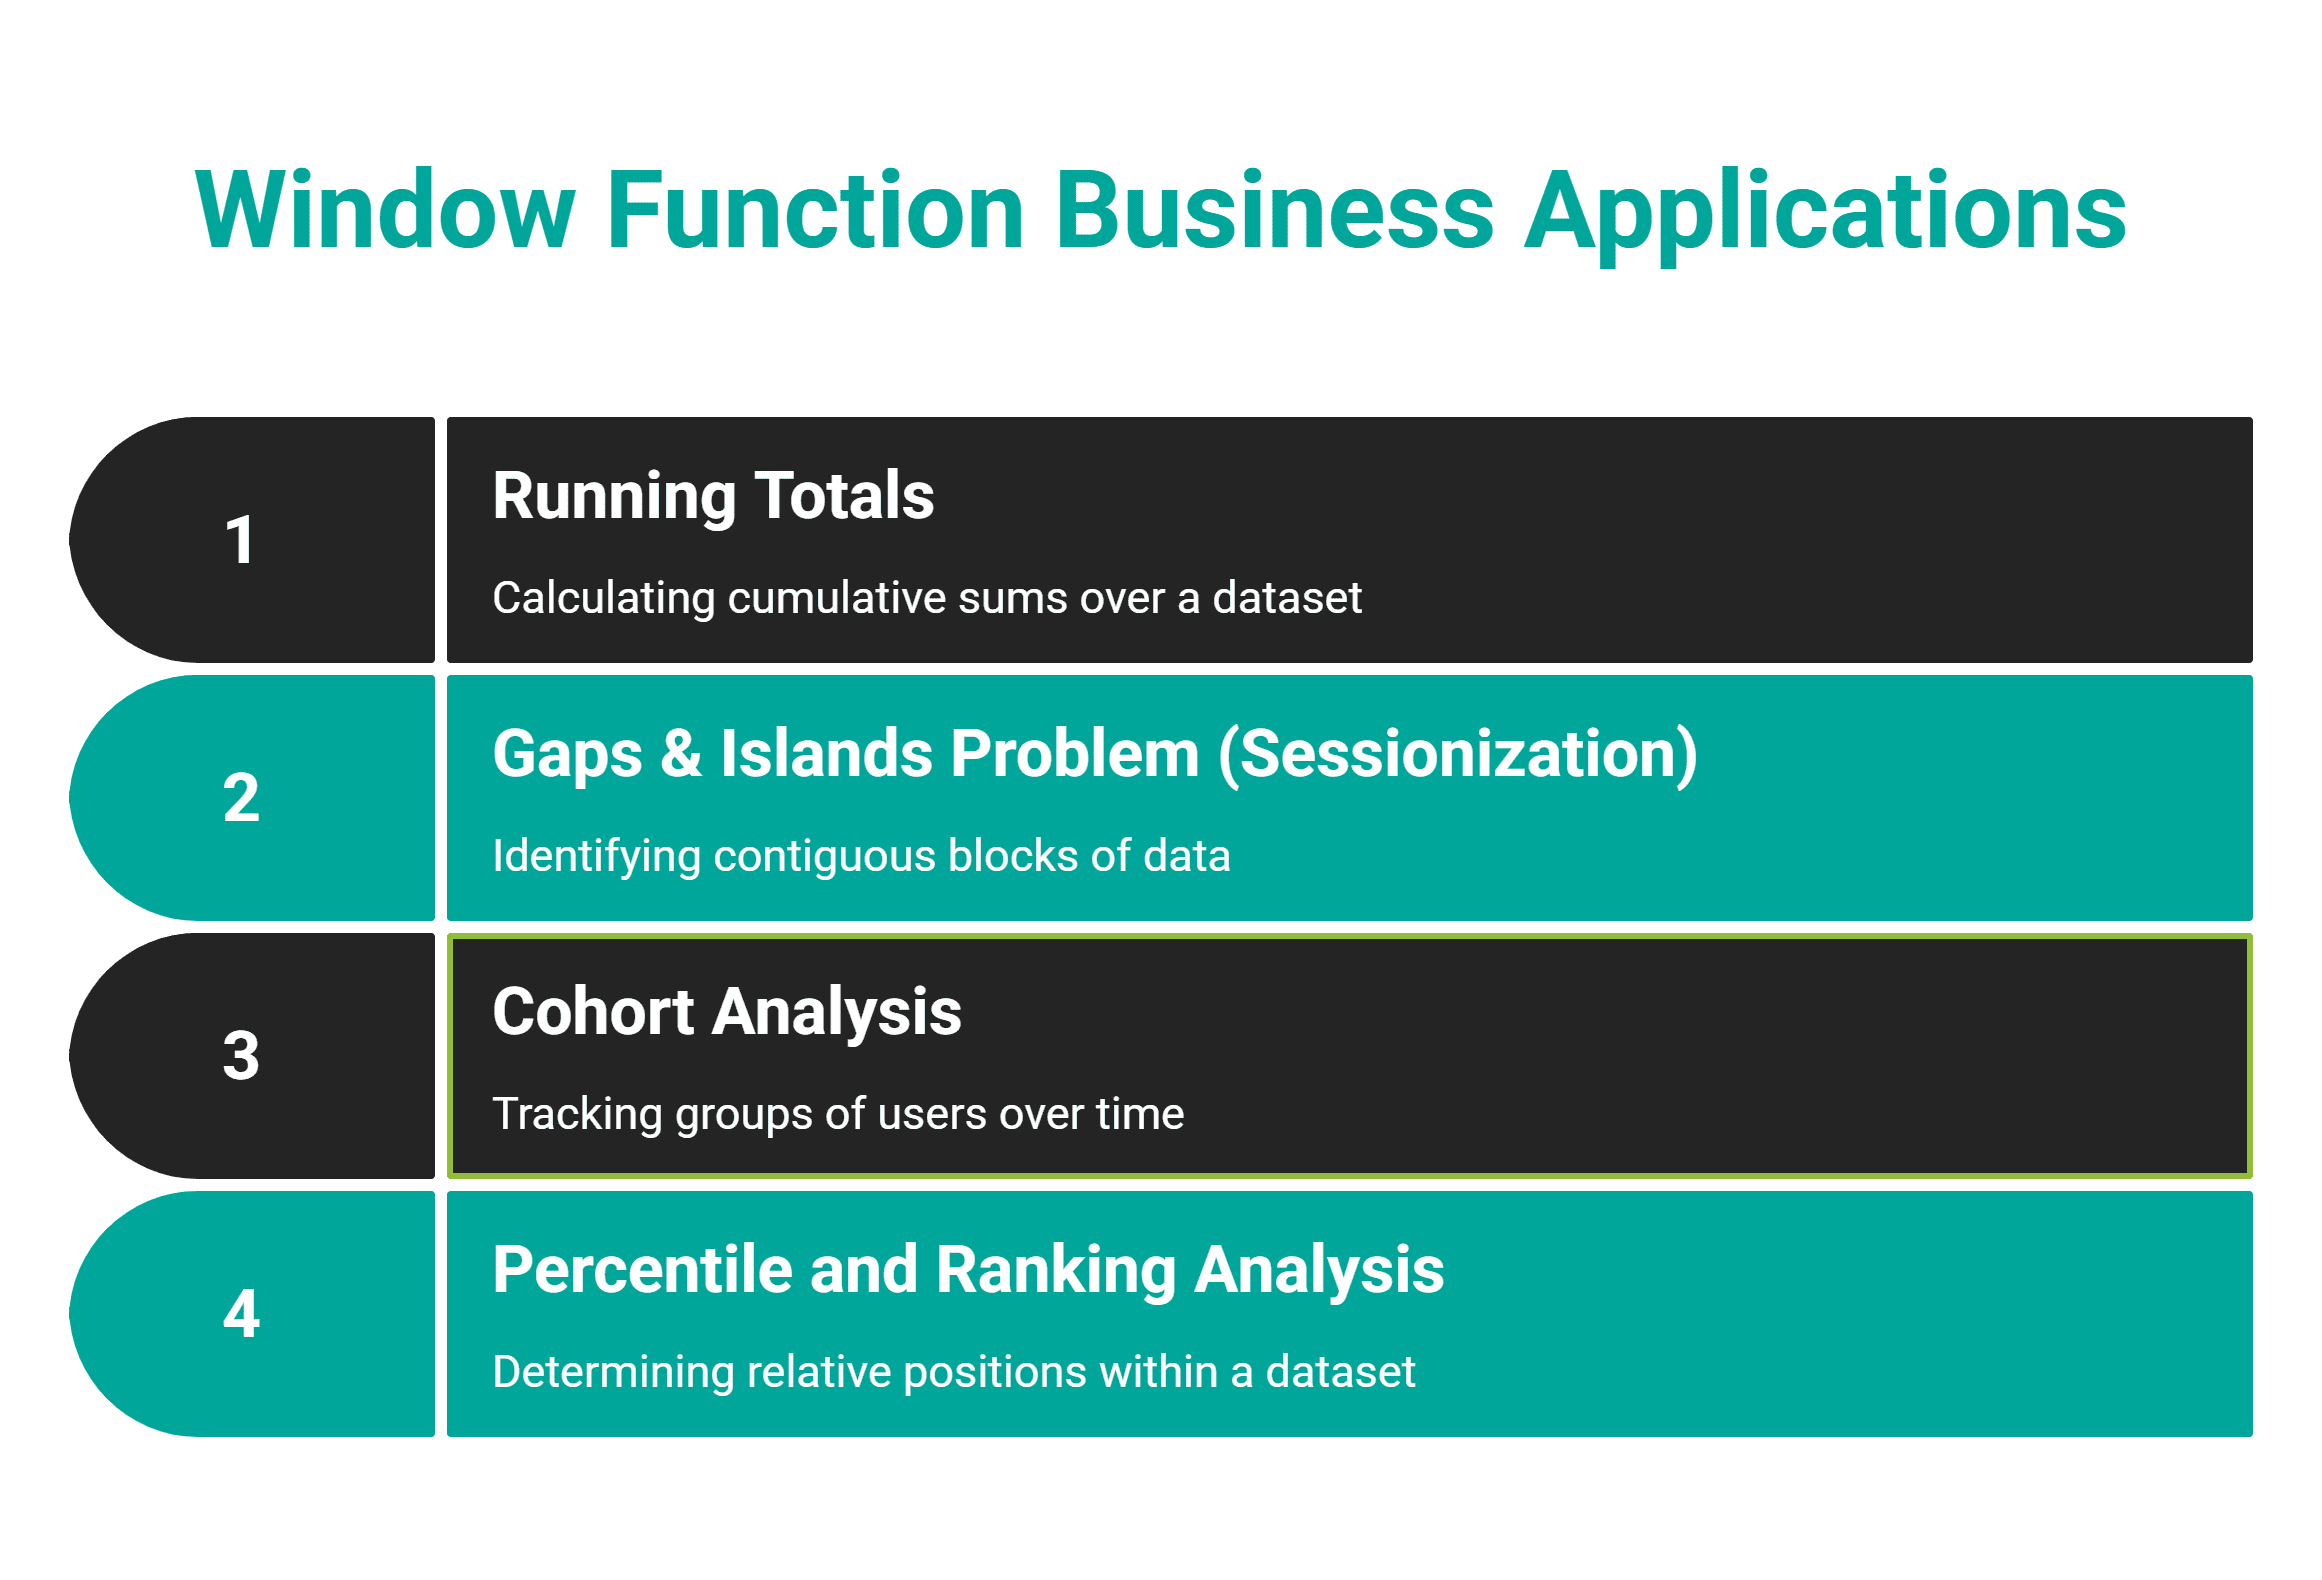
In an increasingly data-driven world, the ability to extract nuanced insights from vast datasets is paramount for business success. While fundamental SQL commands remain the bedrock of database interaction, a new frontier in analytical prowess is being explored through the advanced application of SQL window functions. Beyond their conventional uses for basic aggregations or row numbering, these powerful functions are now being leveraged by data professionals to tackle complex business problems, ranging from granular financial tracking to sophisticated fraud detection and customer behavior analysis. This evolution marks a significant shift in how organizations approach data strategy, demanding a deeper understanding of SQL’s capabilities from their analytical teams.
The growing complexity of business questions, particularly in dynamic sectors like e-commerce, finance, and social media, has necessitated tools that can analyze data contextually without losing individual row integrity. Traditional GROUP BY clauses, while effective for summary statistics, often collapse individual records, making it challenging to simultaneously view both granular data and its aggregated context. SQL window functions elegantly bridge this gap, allowing computations across a set of table rows that are related to the current row, without reducing the number of rows returned. This capability is transforming how data is processed and interpreted, enabling analysts to uncover patterns previously obscured by simpler aggregation methods.
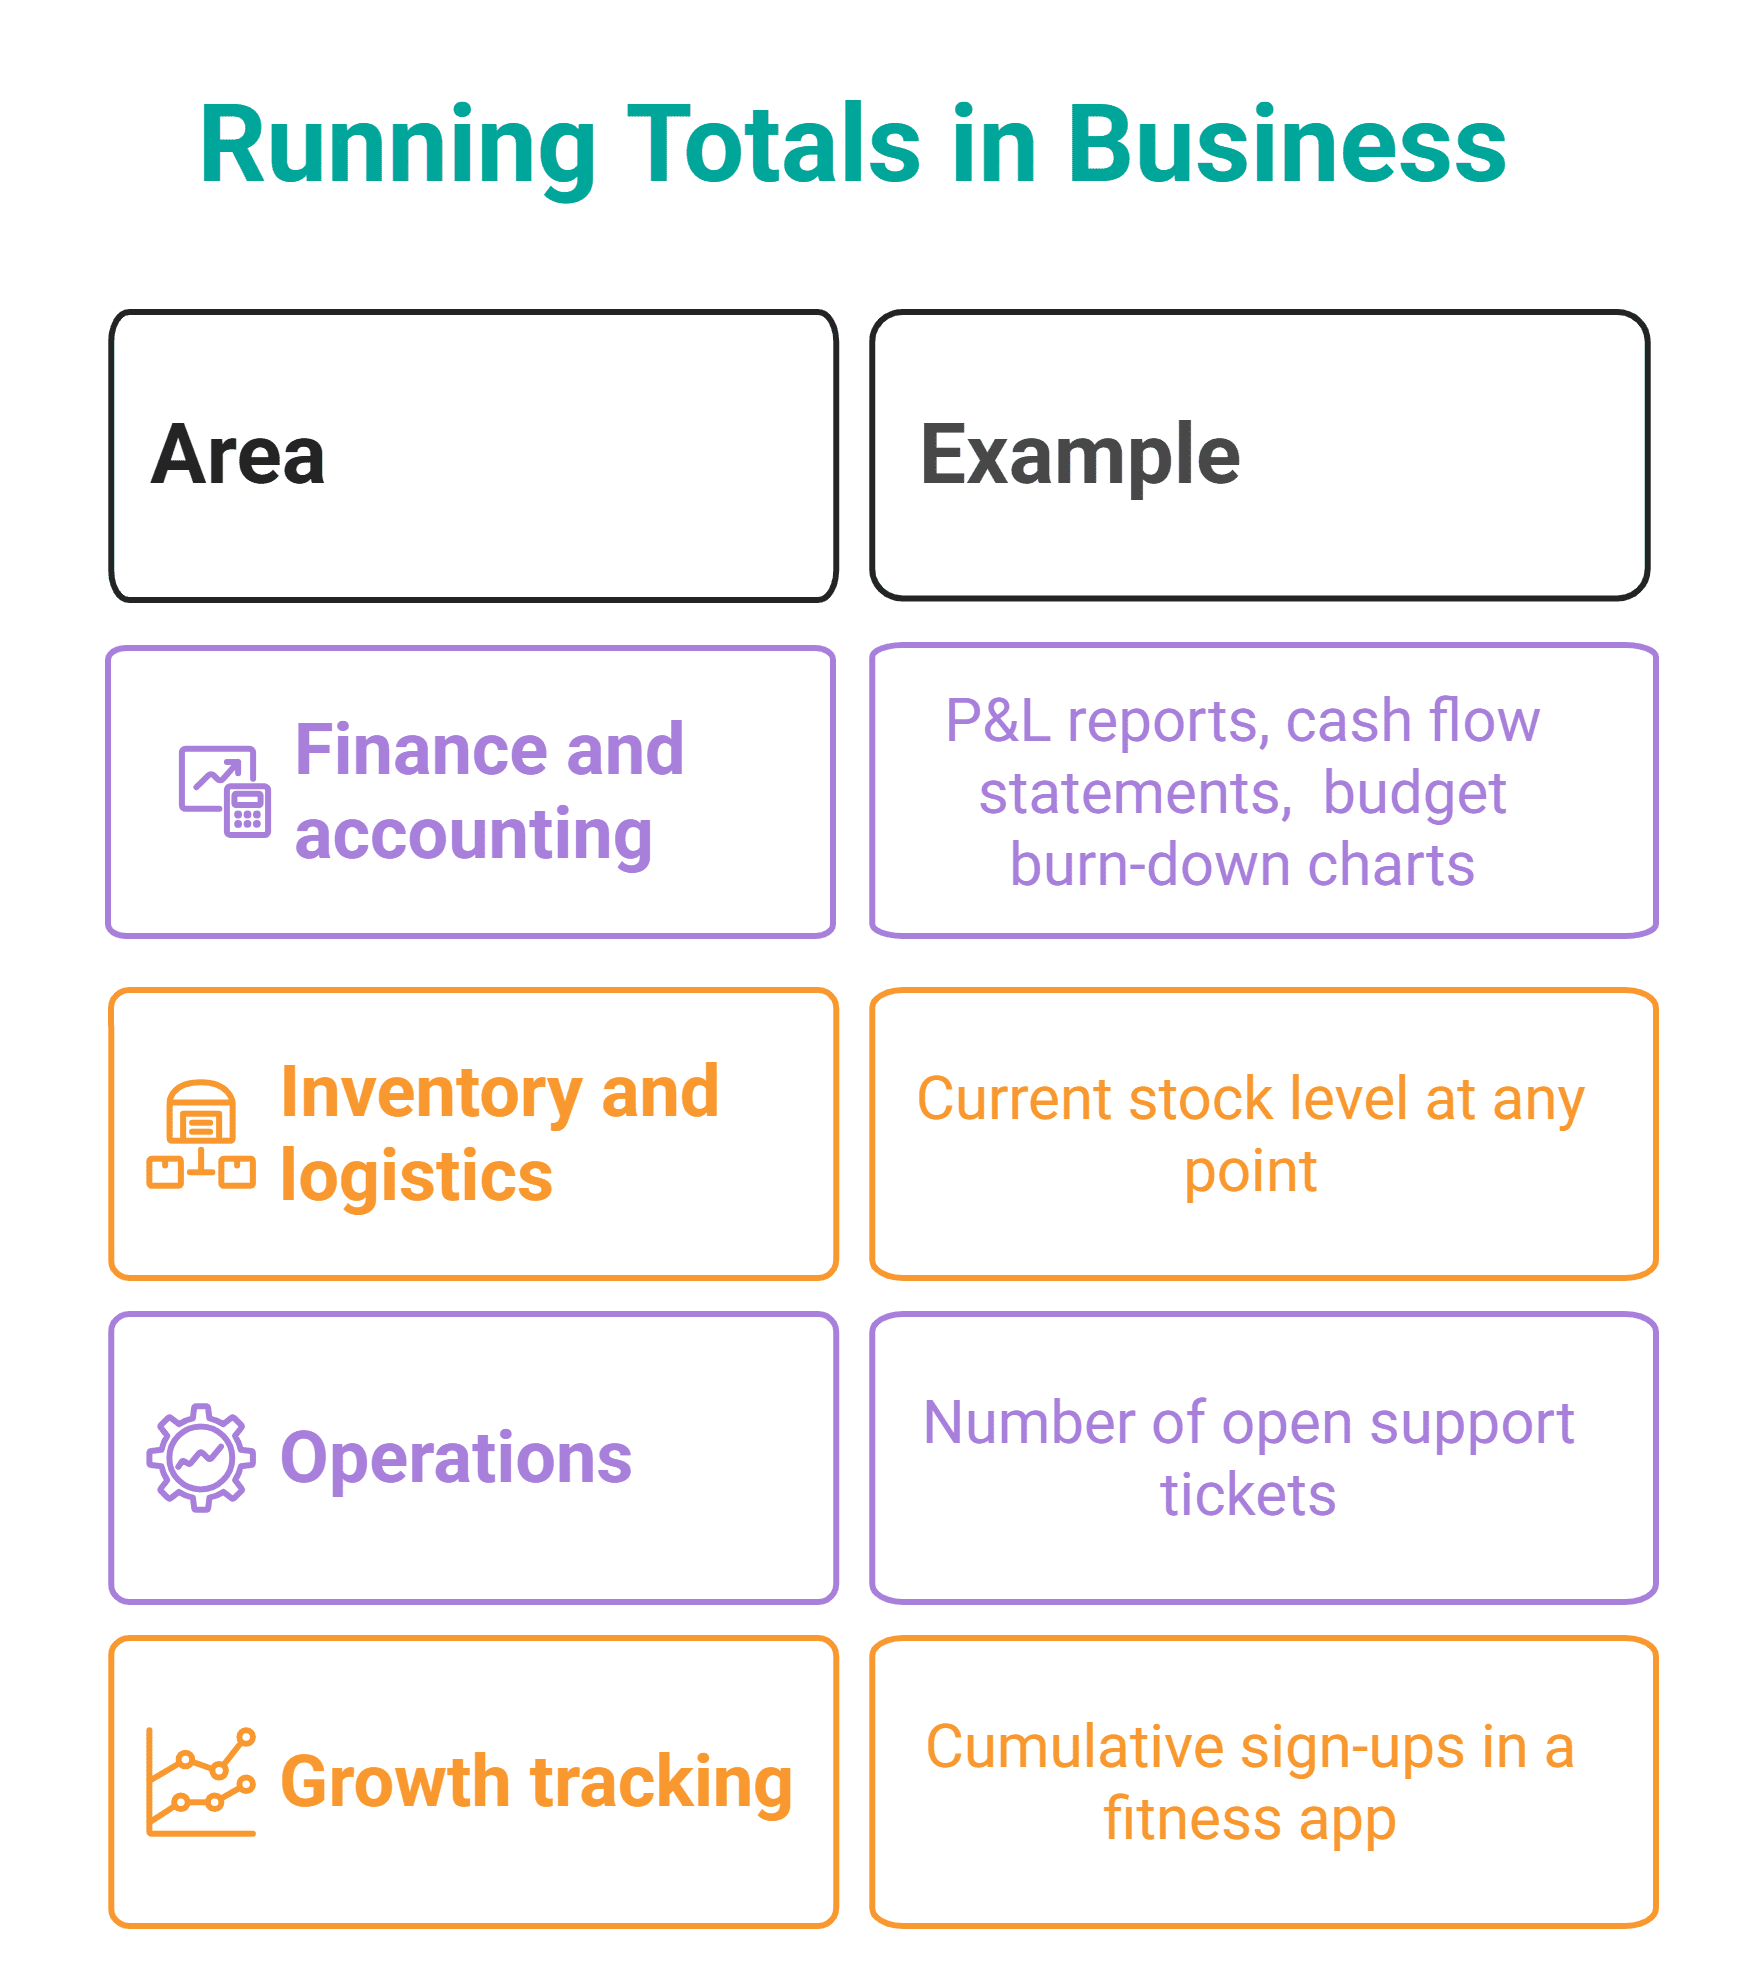
Elevating Financial Oversight with Running Totals

One of the most immediate and impactful applications of advanced window functions is in financial analysis, particularly for calculating running totals. Finance departments, perpetually focused on performance metrics and forecasting, find immense value in tracking cumulative figures over time. This technique is crucial for understanding month-on-month revenue accumulation, progress against annual targets, or the cumulative impact of expenses. For instance, a major e-commerce platform might analyze its monthly sales data to see the continuous growth curve throughout a fiscal year, identifying trends and potential deviations from projections in real-time.
Historically, achieving such cumulative metrics often involved complex self-joins or multiple subqueries, which could be resource-intensive and difficult to maintain. However, with SUM() OVER(ORDER BY date_column), the process becomes streamlined and highly efficient. Consider an amazon_purchases table detailing transactions. An analyst can easily aggregate purchase_amt by month and then apply a window function to calculate the cumulative_revenue for each period. This allows for a direct comparison of current performance against historical trends and financial benchmarks. The default window frame of RANGE BETWEEN UNBOUNDED PRECEDING AND CURRENT ROW inherently defines a cumulative sum, ensuring that each month’s total includes all preceding months’ revenues, offering an uninterrupted view of financial progression. Industry estimates suggest that companies utilizing advanced SQL for financial reporting can achieve up to a 15-20% improvement in reporting efficiency and accuracy, directly impacting strategic financial planning.
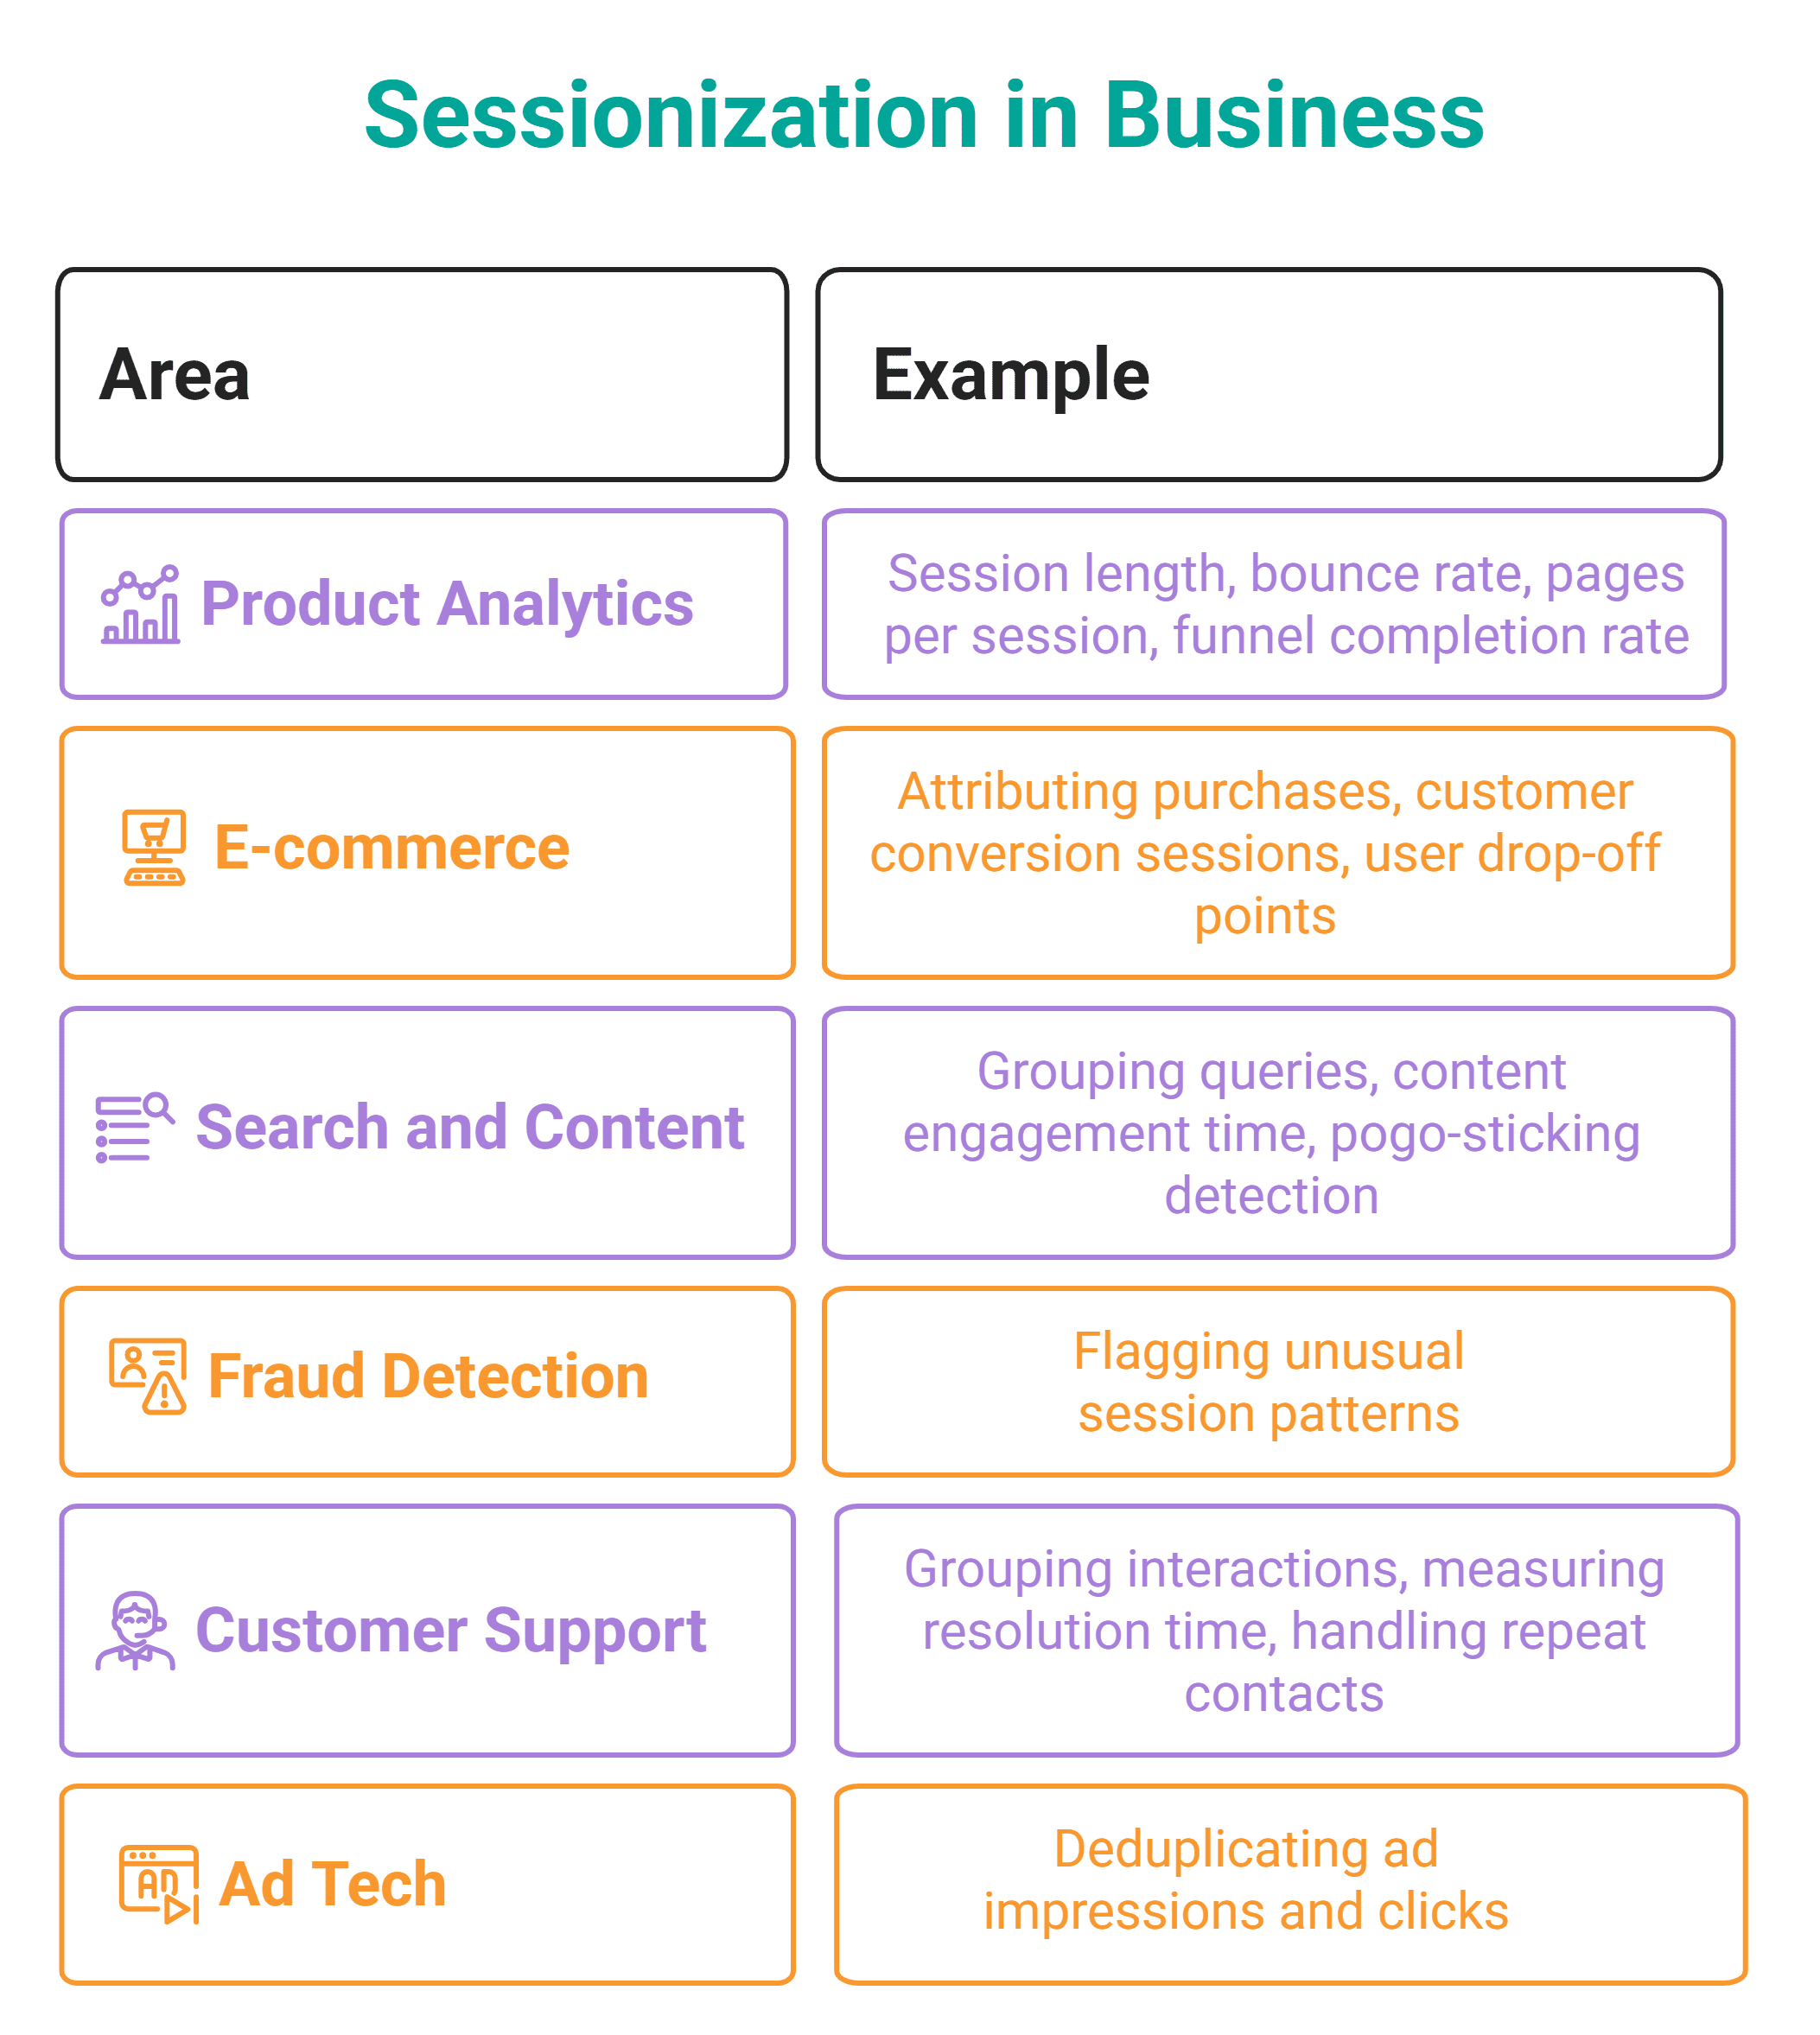
Unraveling User Behavior: The Gaps and Islands Conundrum
Beyond financial metrics, understanding user behavior is critical for product development and marketing. The "Gaps and Islands" pattern, often employed for sessionization, provides profound insights into user engagement streaks and periods of inactivity. An "island" represents a continuous sequence of events satisfying a specific condition, such as consecutive daily logins, while a "gap" signifies a break in that sequence. This analytical pattern is a cornerstone of product and data engineering, enabling the conversion of raw event streams into meaningful user sessions.

For example, a social media giant like LinkedIn or Meta might define a user session as a sequence of interactions where the time between consecutive events does not exceed a predefined timeout, say 30 minutes. Identifying these sessions or "streaks" of activity helps in understanding user stickiness, identifying power users, and pinpointing moments of disengagement. The classic SQL approach to detecting gaps and islands typically involves two key steps: first, identifying the start of a new streak by comparing the current event’s timestamp with the previous one for the same user (often using LAG() and a conditional check); and second, assigning a unique identifier to each continuous streak using a cumulative sum over these "new streak" flags.
A practical application involves analyzing user visit streaks. Given a user_streaks table with user_id and date_visited, an analyst can determine the longest consecutive visit streaks for each user. This involves distinguishing unique visits, flagging new streaks when a day’s visit doesn’t follow the previous day’s consecutively, and then assigning a streak_id using a cumulative sum of these flags. Finally, the length of each streak_id can be counted, and users with the top streaks identified. This granular understanding of user engagement allows product teams to tailor features, optimize onboarding flows, and launch targeted retention campaigns, potentially boosting user retention rates by 5-10% in competitive digital landscapes.
Driving Customer Retention with Cohort Analysis
For businesses focused on customer lifetime value and retention, cohort analysis stands as an indispensable analytical technique. A cohort groups users who share a common starting event, such as their first purchase, initial login, or subscription date. By tracking these groups over time, businesses can answer fundamental questions about customer churn, product adoption, and the effectiveness of marketing initiatives. The core challenge in cohort analysis is establishing a clear "cohort anchor" – the initial event against which all subsequent user activity is measured.
SQL window functions simplify this process by allowing analysts to identify and associate this anchor event with every subsequent action of a customer. Approaches often involve using FIRST_VALUE() to capture a customer’s first interaction, or ROW_NUMBER() to identify the first instance of a specific event. For instance, a food delivery service like DoorDash might want to understand how many customers made their first order with a particular merchant and how many total orders that merchant received.
Using an order_details table alongside merchant_details, an analyst can determine each customer’s first merchant_id using FIRST_VALUE(merchant_id) OVER(PARTITION BY customer_id ORDER BY order_timestamp). This first_merchant attribute is then joined back to the full order history. By counting distinct customers for whom a merchant was their first_merchant, and simultaneously counting total orders, the business gains insights into merchant-specific customer acquisition and overall order volume. This analysis reveals which merchants are effective at attracting new customers (cohort anchors) versus those that primarily serve existing ones. Such insights are vital for optimizing merchant partnerships, identifying successful business models, and ultimately improving customer acquisition strategies, which according to recent studies, can reduce customer acquisition costs by up to 25% when effectively targeted.
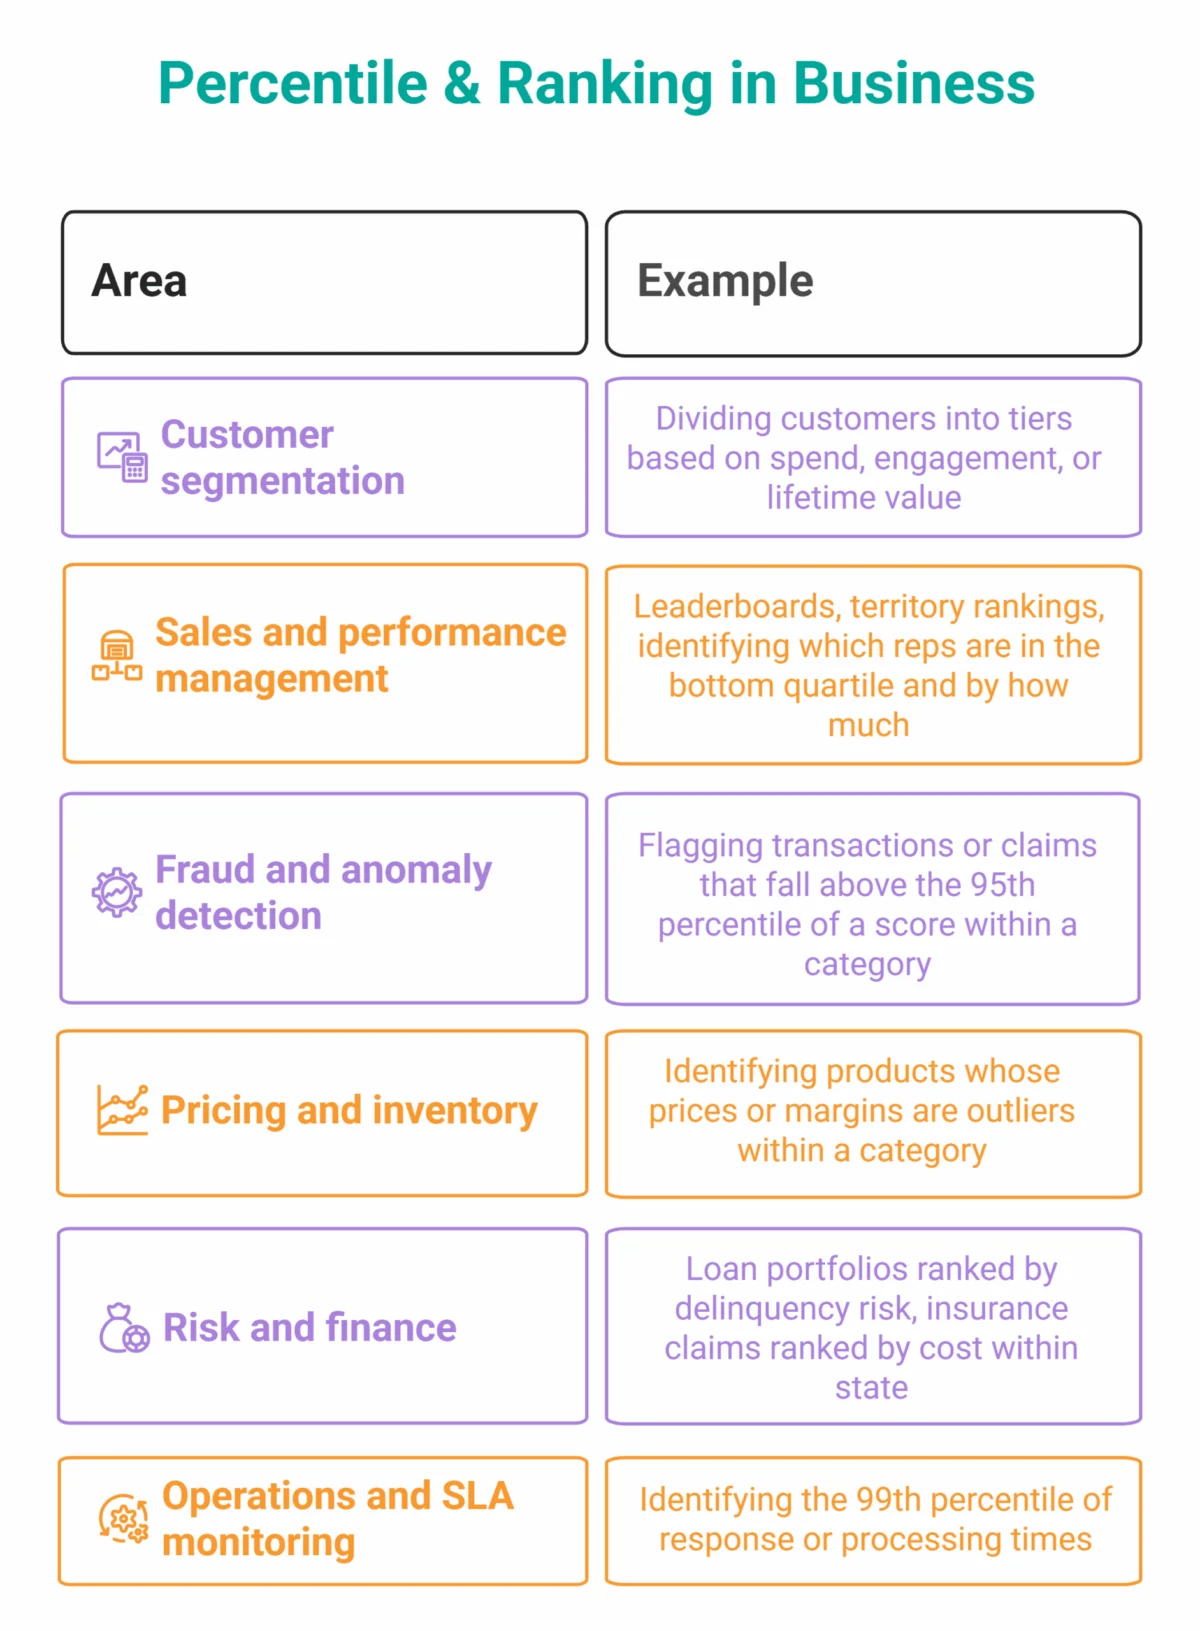
Precision in Performance: Percentile and Ranking Analysis
While aggregate functions provide averages, they often obscure the underlying distribution of data, which holds critical business intelligence. Percentile and ranking analysis, powered by window functions, offers a deeper dive into data distribution, revealing outliers and performance tiers. Questions like "Is our 90th percentile order value unusually high?" or "Are the bottom 25% of sales representatives significantly underperforming?" can only be answered by understanding the data’s spread.
Functions like NTILE(n) divide rows into n approximately equal groups, PERCENT_RANK() expresses a row’s rank as a value between 0 and 1, and CUME_DIST() indicates the fraction of rows with a value less than or equal to the current row. Perhaps most powerfully, PERCENTILE_CONT() computes the actual interpolated value at a given percentile threshold. This is particularly valuable for establishing dynamic cutoffs or identifying anomalies.
A compelling use case is in fraud detection, a critical area for companies like Google and Netflix. Given a fraud_score table with policy_num, state, claim_cost, and fraud_score, the objective might be to identify the top 5% of potentially fraudulent claims within each state. Instead of relying on a fixed global threshold, PERCENTILE_CONT(0.95) WITHIN GROUP (ORDER BY fraud_score) AS p95 can dynamically calculate the 95th percentile fraud score for each state. Claims with a fraud_score at or above this state-specific threshold are then flagged as suspicious. This adaptive approach ensures that fraud detection is tailored to regional patterns, improving the accuracy and fairness of anomaly identification. Such targeted fraud detection can significantly reduce losses, with some financial institutions reporting up to a 30% reduction in fraudulent claims by adopting sophisticated analytical models.
The Broader Impact and Future Outlook
The sophistication offered by advanced SQL window functions underscores a fundamental shift in data analysis. These techniques empower data professionals to move beyond superficial reporting to construct intricate analytical logic that mirrors the complexity of real-world business problems. The ability to chain Common Table Expressions (CTEs), apply multiple window functions within a single SELECT statement, and craft highly expressive SQL queries is becoming a hallmark of proficient data science and analytics teams.
Industry experts, including figures like Nate Rosidi, a data scientist and founder of StrataScratch, emphasize that true mastery of SQL extends beyond basic syntax. "The real power of window functions lies in their composability and their ability to solve problems that would be incredibly cumbersome with traditional SQL," Rosidi has noted in discussions on data skill development. "They allow analysts to perform complex calculations directly within the database, leading to more efficient queries and deeper insights."
As the volume and velocity of data continue to grow, the demand for analysts proficient in these advanced SQL techniques will only intensify. Companies across sectors are actively seeking professionals who can leverage these tools not just for reporting, but for predictive modeling, anomaly detection, and strategic decision-making. Platforms providing real-world interview questions, like StrataScratch, are becoming essential resources for data professionals looking to hone these critical skills. The trajectory of data analysis clearly points towards greater sophistication in querying and computation, with SQL window functions playing an increasingly central role in shaping the future of business intelligence.


Leave a Reply