
The intersection of artificial intelligence and corporate workflow automation has reached a new milestone with the introduction of advanced data-to-presentation generation tools, notably developed by platforms such as Julius AI. Historically, transforming raw spreadsheet data into client-ready or leadership-facing slide decks required hours of manual extraction, calculation, chart formatting, and graphic design. Today, professionals across finance, marketing, and corporate strategy are increasingly adopting automated systems that bridge the gap between tabular spreadsheets and polished visual narratives. However, industry analysts and data scientists emphasize that bypassing foundational data hygiene and structured prompt engineering can compromise the accuracy of AI-generated outputs. Establishing a rigorous, multi-step verification protocol remains essential for maintaining institutional integrity when deploying generative tools for executive reporting.
The evolution of automated business reporting traces back to the early adoption of basic data visualization plugins within legacy spreadsheet software. Throughout the late 2010s and early 2020s, organizations relied heavily on static templates and manual copy-pasting to translate quarterly metrics into Microsoft PowerPoint formats. While these methods reduced some friction, they frequently resulted in formatting errors, outdated metrics, and significant bottlenecks during high-stakes reporting cycles. The recent integration of large language models capable of reading multi-sheet workbooks, executing calculations, and natively exporting editable presentation files represents a paradigm shift. Platforms like Julius AI now allow users to upload complex Comma-Separated Values (CSV) and Excel files, execute cross-sheet audits, and generate structured slide decks through conversational commands.
To evaluate the operational efficacy of this technology, data architects examine a standard quarterly marketing performance review framework. In a typical corporate scenario, a marketing director must synthesize multi-channel revenue streams and advertising expenditures to present before a corporate leadership team. The underlying sample dataset involves a comparative analysis between the first and second quarters of a fiscal year, tracking metrics across organic search, paid search, and corporate partnerships. All fiscal amounts are denominated in whole United States dollars, with explicit boundaries separating raw transactional inputs from reference calculation sheets.
Executing a reliable AI-driven presentation workflow requires a structured, chronological methodology rather than a single generalized prompt. Industry best practices recommend dividing the process into five distinct operational phases: defining the core analytical objective, conducting pre-analysis data audits, verifying mathematical computations, constructing a precise presentation brief, and executing final editorial reviews on the exported file.
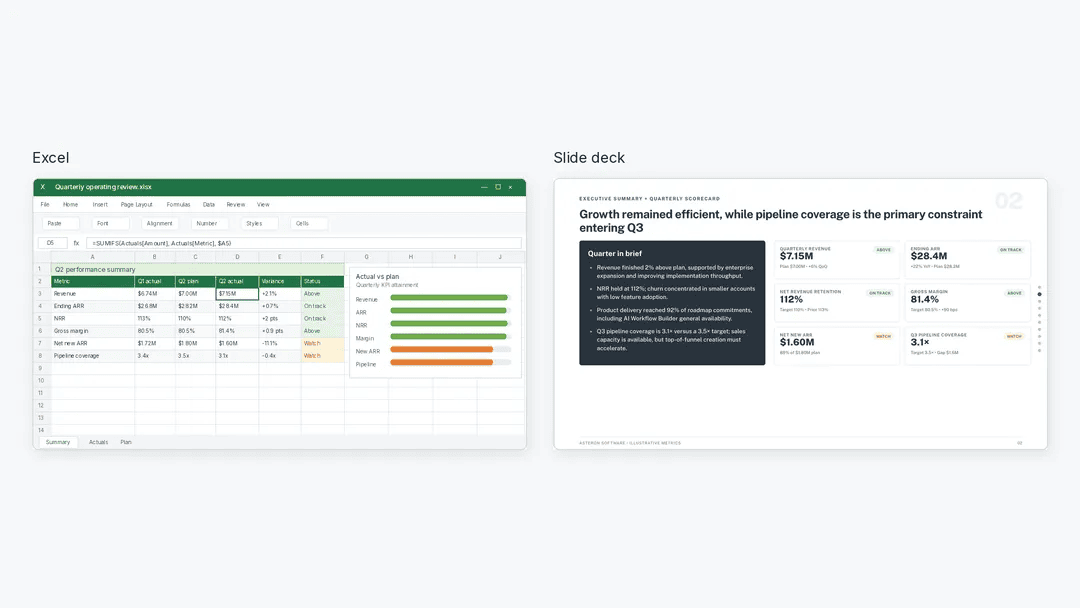
Phase one centers on establishing the precise question the presentation must answer. Rather than prompting an AI tool to generate a generic overview of marketing performance, analysts must brief the system on specific strategic inquiries—such as evaluating revenue fluctuations and assessing budget efficiency ahead of upcoming fiscal planning. Phase two involves uploading the multi-tab workbook to the platform and executing targeted inspection commands. Analysts direct the system to read specific tabs, confirm temporal periods and units, and flag anomalies, missing values, or duplicate records without prematurely altering the source data or generating slides.
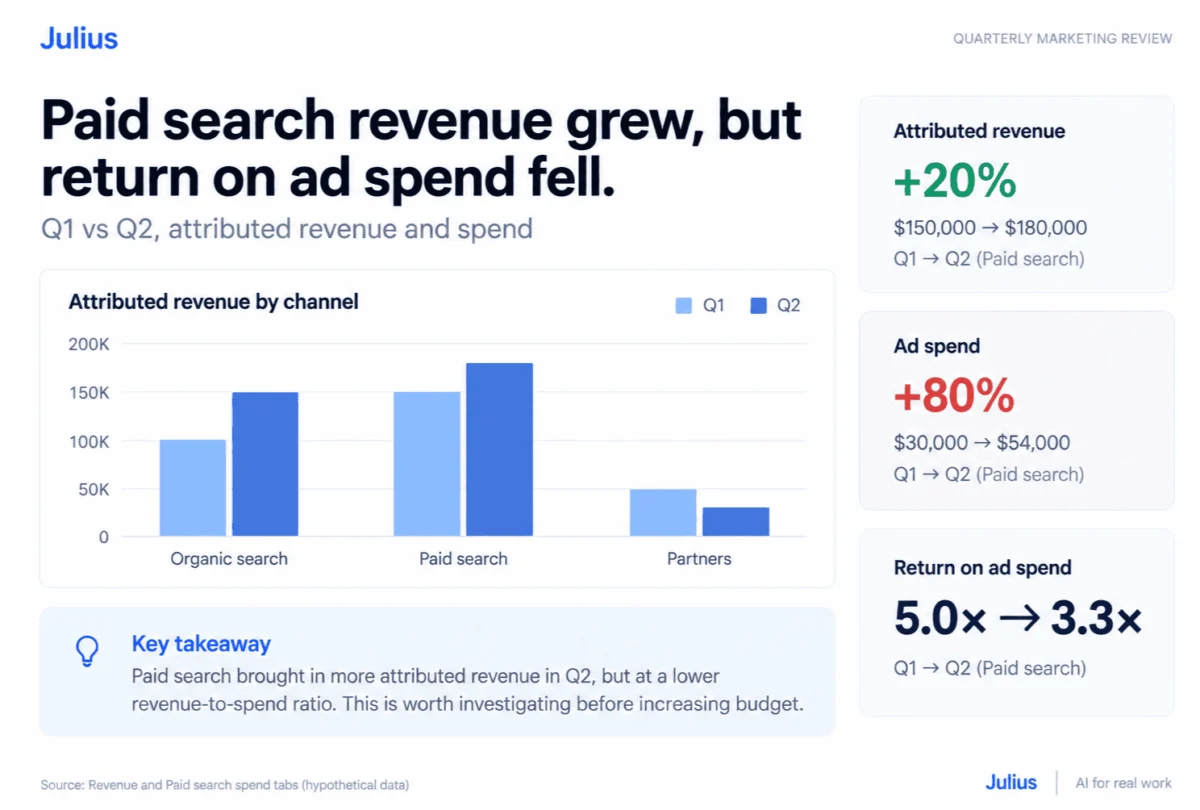
Phase three requires rigorous computational verification. In the evaluated marketing dataset, total attributed revenue grew from $300,000 in the first quarter to $360,000 in the second quarter, representing a net 20 percent increase of $60,000. Channel-specific breakdowns indicate that organic search revenue expanded by 50 percent, moving from $100,000 to $150,000, while paid search revenue rose by 20 percent, from $150,000 to $180,000. Conversely, partner-attributed revenue contracted by 40 percent, dropping from $50,000 to $30,000. Crucially, supplementary analysis of advertising expenditures reveals that paid search media costs surged by 80 percent, escalating from $30,000 to $54,000. Consequently, the return on ad spend (ROAS)—calculated as attributed revenue divided by media spend—declined from 5.0x in the first quarter to approximately 3.3x in the second quarter.
Industry experts and corporate communications professionals have expressed cautious optimism regarding these automated documentation workflows. Representatives from data analytics firms note that while generative tools dramatically reduce administrative latency, human oversight is indispensable for contextualizing complex metrics. For instance, an unvetted AI generation might highlight a 20 percent increase in paid search revenue as an unqualified success, inadvertently obscuring the simultaneous 80 percent escalation in advertising costs and the resulting compression in profit efficiency. By enforcing rigorous validation standards, organizations mitigate the risk of presenting misleading conclusions to executive boards.
Phase four transitions verified findings into a comprehensive presentation brief. Users instruct the platform to generate a fixed-slide structure tailored to specific audience constraints, such as a ten-minute leadership review. Prompts dictate the inclusion of takeaway titles, clear currency and period labels, source citations beneath charts, and explicit constraints against unverified forecasting or margin assumptions. Phase five mandates the immediate export of the PowerPoint file for manual inspection. Analysts review formatting consistency, typography, chart legibility, and structural integrity to ensure that the deck is fully editable and ready for institutional distribution.
The broader implications of AI-driven presentation tools extend across multiple sectors, transforming how organizations handle internal reporting, client deliverables, and strategic forecasting. By automating the mechanical aspects of slide creation—such as layout alignment, color scheme application, and basic chart rendering—these platforms free knowledge workers to focus on strategic interpretation and decision-making. As machine learning algorithms become more deeply embedded in enterprise software suites, the standard for corporate reporting will likely shift toward real-time, dynamically generated visual narratives underpinned by verifiable data pipelines.