
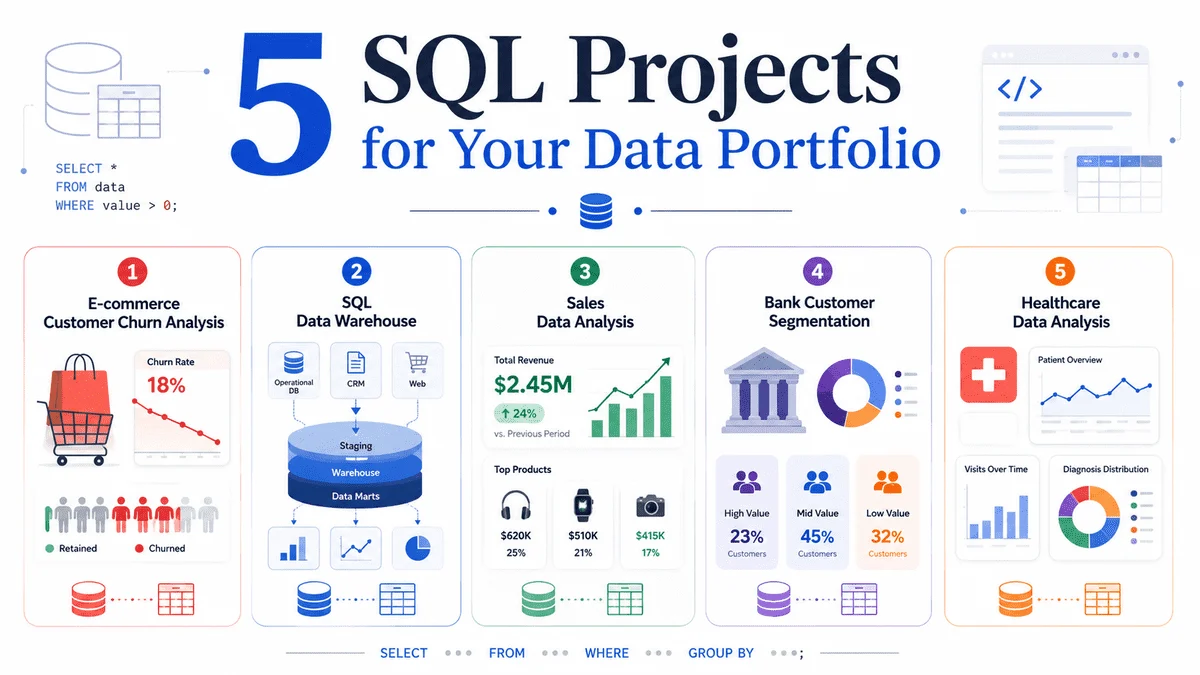
SQL remains a cornerstone skill for professionals across the data landscape, from data analysts and scientists to business intelligence specialists and analytics engineers. However, merely understanding SQL syntax is a preliminary step; true proficiency is demonstrated by the ability to leverage SQL for addressing tangible business challenges. This distinction is where a robust portfolio of real-world projects becomes invaluable, differentiating candidates in a competitive job market. A compelling SQL project extends beyond simple query execution, showcasing capabilities in data cleaning, exploratory analysis, deriving business insights, and communicating these findings with clarity.
This article delves into five impactful SQL projects designed to significantly strengthen a data professional’s portfolio. Each project highlights a practical industry use case, outlines the specific SQL skills cultivated, and provides links to actual GitHub or Kaggle repositories for practical exploration and inspiration. These projects are carefully selected to represent diverse applications of SQL, from customer behavior analysis to complex data warehousing, offering a comprehensive view of SQL’s utility in modern data environments.
The Enduring Relevance of SQL in the Data Economy
In an era increasingly dominated by complex machine learning models and advanced analytics, the foundational role of SQL might sometimes be underestimated. Yet, SQL (Structured Query Language) continues to be the lingua franca for interacting with relational databases, which form the backbone of nearly every enterprise application, transactional system, and data warehouse globally. Its enduring relevance stems from its efficiency in managing, querying, and manipulating vast datasets, making it indispensable for anyone working with data.
The evolution of data roles has seen an increasing demand for professionals who can not only write efficient queries but also understand the underlying business context and translate data into actionable strategies. A 2023 survey by Stack Overflow, for instance, consistently ranks SQL among the most commonly used programming languages, underscoring its pervasive utility. Moreover, the global data analytics market, valued at over $200 billion in 2022 and projected to grow significantly, relies heavily on SQL for initial data preparation and exploration, making practical SQL project experience a critical asset for aspiring and seasoned data professionals alike.
1. E-commerce Customer Churn Analysis Using SQL
Project Overview and Business Context
Customer churn represents a critical challenge for e-commerce businesses, directly impacting revenue and long-term sustainability. The cost of acquiring a new customer is often significantly higher than retaining an existing one, making churn reduction a top strategic priority. This SQL project focuses on analyzing customer behavior to identify the root causes of customer attrition. By delving into various customer attributes and transactional histories, businesses can proactively intervene to prevent valuable customers from leaving.
Technical Deep Dive and Skill Development
In this project, participants explore a simulated e-commerce dataset, examining factors such as customer complaints, order frequency, satisfaction scores, preferred payment methods, coupon usage patterns, customer tenure, and the recency of their last order. The primary objective is to uncover patterns that correlate with churn and subsequently propose data-driven strategies for improving customer retention.
Key SQL skills honed during this project include:
GROUP BYand Aggregations: Essential for summarizing data, such as calculating average order values per customer segment or total orders by payment method. This allows for the computation of churn rates across different groups.CASE WHENStatements: Used for conditional logic, such as categorizing customers based on their tenure (e.g., ‘new’, ‘mid-term’, ‘long-term’) or identifying specific churn triggers.- Filtering (
WHEREandHAVING): Employed to isolate specific customer segments or transactions, for instance, filtering for customers who have made complaints or those whose last order was more than 90 days ago. - Subqueries and Common Table Expressions (CTEs): For breaking down complex analytical tasks into manageable steps, such as first calculating individual customer metrics and then aggregating those for churn analysis.
- Churn-Rate Calculations: Developing SQL logic to compute churn rates based on customer activity over defined periods. This often involves comparing active customer counts between two time points.
- Customer Segmentation: Applying SQL to group customers into meaningful segments (e.g., high-value, at-risk, loyal) based on their purchasing behavior and demographic data.
Implications and Industry Relevance
Mastering this project demonstrates a direct link between SQL proficiency and impactful business decision-making. Insights derived from churn analysis can directly inform targeted marketing campaigns, personalized customer service initiatives, product development enhancements, and pricing strategies. For example, identifying that customers who experience more than two product complaints within their first three months are significantly more likely to churn can lead to immediate improvements in post-purchase support. According to a report by Statista, global e-commerce sales are projected to exceed $6 trillion by 2027, making customer retention an increasingly vital aspect of competitive strategy. Professionals capable of performing such analyses are highly sought after in retail, e-commerce, and subscription-based service industries.
2. SQL Data Warehouse Project
Project Overview and Business Context
Moving beyond ad-hoc analysis, a SQL Data Warehouse project signifies a substantial leap in a data professional’s capabilities. This project focuses on the architectural and engineering aspects of data management, teaching the fundamentals of building a modern data warehouse. Data warehouses are crucial for businesses that need to consolidate data from various operational systems into a single, unified repository optimized for analytical queries and reporting. They transform raw, disparate data into structured, clean, and easily queryable information, supporting business intelligence and strategic decision-making.
Technical Deep Dive and Skill Development
This project guides participants through the complete data workflow, typically using a platform like Microsoft SQL Server (though concepts are transferable to other RDBMS). The process involves:
- Extract, Transform, Load (ETL): Designing and implementing robust ETL pipelines to extract raw data from source systems, clean and transform it according to business rules, and load it into the data warehouse. This often involves complex SQL scripts for data manipulation, validation, and error handling.
- Data Cleaning: Addressing inconsistencies, missing values, duplicates, and errors in raw data using SQL functions and conditional statements.
- Data Modeling: Creating logical and physical data models for the warehouse. This is a core component, focusing on:
- Fact Tables: Storing quantitative data (measures) about business events (e.g., sales transactions, patient visits).
- Dimension Tables: Storing descriptive attributes related to facts (e.g., product details, customer demographics, time periods).
- Star Schema Design: The most common data warehouse schema, where a central fact table connects to multiple dimension tables.
- SQL-based Reporting: Developing SQL queries to extract data for business reports and dashboards, ensuring that the aggregated data accurately reflects business performance indicators.
The project often follows a "Bronze, Silver, Gold" architecture, a common pattern in modern data lakes and warehouses:
- Bronze Layer: Stores raw, untransformed data, mirroring the source systems.
- Silver Layer: Contains cleaned, semi-processed data, where basic transformations and data quality checks have been applied.
- Gold Layer: Houses highly curated, aggregated, and modeled data, ready for business users, reporting, and advanced analytics.
Implications and Industry Relevance
This project is exceptionally strong for portfolios because it demonstrates an understanding of how real-world data systems are constructed, not merely how to query existing tables. It is particularly valuable for individuals aspiring to roles in analytics engineering, business intelligence development, or data engineering. The global data warehousing market is projected to reach over $50 billion by 2030, reflecting the continuous need for robust data infrastructure. Professionals with data warehousing experience are critical for organizations seeking to build scalable, reliable, and performant analytical platforms. It shows a candidate’s ability to think architecturally and manage data across its lifecycle, a skill set highly prized in enterprise environments.
3. Sales Data Analysis Using SQL
Project Overview and Business Context
Sales analysis is a universally applicable and highly practical SQL project, directly correlating with a company’s financial health and market performance. Every business, regardless of industry, generates sales data, and the ability to extract meaningful insights from this data is paramount. This project involves leveraging SQL to uncover patterns, trends, and key performance indicators (KPIs) related to revenue generation, product performance, customer purchasing habits, and market dynamics.
Technical Deep Dive and Skill Development
Participants in this project use SQL to analyze sales transactions, product information, customer demographics, and regional sales data. Common analytical questions include:
- Which products or product categories generate the highest revenue?
- How has revenue evolved over specific time periods (e.g., monthly, quarterly, annually)?
- Which customer segments contribute most to overall sales?
- Are there observable seasonal patterns in sales data that could inform inventory or marketing strategies?
The SQL skills reinforced and expanded include:
JOINOperations: Combining data from multiple tables (e.g., sales orders with product details, customer information). Mastery of variousJOINtypes (INNER, LEFT, RIGHT, FULL OUTER) is crucial.- Aggregations (
SUM,AVG,COUNT,MAX,MIN): Calculating total sales, average order values, number of unique customers, and identifying peak sales periods. - Sorting (
ORDER BY): Arranging results to easily identify top-performing products, customers, or sales regions. - Filtering (
WHERE): Isolating specific transactions, products, or timeframes for focused analysis. - Date Functions: Using functions like
DATE_TRUNC,EXTRACT,DATEDIFFto analyze sales trends over time, identify year-over-year growth, or calculate sales velocity. - Grouping (
GROUP BY): Aggregating data by dimensions such as product, customer, date, or region to identify performance metrics across different categories.
Implications and Industry Relevance
A well-executed sales analysis project directly impacts strategic business decisions in areas such as product development, pricing, inventory management, and marketing campaign targeting. For instance, identifying a declining sales trend for a particular product line could prompt a review of its pricing or a decision to discontinue it. Conversely, recognizing a surge in demand for certain products during specific seasons allows businesses to optimize inventory and marketing efforts. To make this project portfolio-ready, it is essential to present not just the SQL queries but also a concise business summary of the findings, augmented by simple visualizations (e.g., bar charts for product performance, line graphs for revenue trends) that effectively communicate insights. The retail industry alone generates trillions in sales globally, making sales data analysis an evergreen skill for data professionals.
4. Bank Customer Segmentation Analysis
Project Overview and Business Context
Customer segmentation is a powerful analytical technique, particularly vital in the financial services sector where understanding diverse customer needs and behaviors is critical for competitive advantage. Banks and financial institutions utilize segmentation to tailor product offerings, personalize marketing messages, manage risk, and enhance customer satisfaction. This project involves analyzing a simulated banking dataset to identify distinct customer groups based on their transactional activity, account types, demographics, and regional characteristics.
Technical Deep Dive and Skill Development
In this project, participants use SQL to analyze customer data, including account balances, transaction histories, loan statuses, and demographic information. The goal is to identify various customer segments, such as:
- High-Value Customers: Those with significant balances, frequent transactions, or multiple banking products.
- Active vs. Dormant Accounts: Distinguishing customers based on their recent engagement.
- Top Transaction Patterns: Identifying common types of transactions (e.g., deposits, withdrawals, transfers) and their frequencies.
- Regional Performance: Analyzing how customer behavior and account activity vary across different geographic regions.
This project offers an excellent opportunity to practice advanced SQL concepts:
- Common Table Expressions (CTEs): Crucial for breaking down complex segmentation logic into readable, modular steps. For example, a CTE might first calculate each customer’s total transaction value, and another might then categorize them based on that value.
JOINOperations: Combining data from various tables like customer details, account information, and transaction logs.- Aggregations: Calculating sum of balances, average transaction amounts, and count of transactions per customer or segment.
- Window Functions: These are particularly powerful for segmentation. Functions like
ROW_NUMBER(),RANK(),NTILE(),LAG(), andLEAD()can be used to:- Rank customers by their transaction volume or balance within specific categories.
- Assign customers to quantiles (e.g., top 25% of spenders).
- Analyze sequential transactions to identify patterns over time.
- Segmentation Logic: Implementing complex
CASE WHENstatements and logical operators to define and assign customers to specific segments based on multiple criteria.
Implications and Industry Relevance
A successful bank customer segmentation project directly leads to more effective marketing campaigns, personalized product recommendations, and improved risk management strategies. For instance, high-value customers might receive exclusive offers or dedicated relationship managers, while dormant account holders could be targeted with re-engagement campaigns. Furthermore, segmentation aids in compliance efforts like Know Your Customer (KYC) and anti-money laundering (AML) by highlighting unusual transaction patterns within specific groups. The fintech sector, rapidly expanding globally, relies heavily on sophisticated customer analytics. Professionals who can demonstrate expertise in this area are highly valued in banking, financial analytics, and customer intelligence roles. The ability to translate complex data into actionable customer profiles is a critical skill for navigating the intricacies of financial markets.
5. Healthcare Data Analysis Using SQL
Project Overview and Business Context
Healthcare data analysis presents a uniquely impactful SQL portfolio project due to its direct relevance to public health, patient care, and operational efficiency within a critical industry. The healthcare sector is undergoing a massive digital transformation, with an exponential increase in Electronic Health Records (EHRs), medical imaging, and administrative data. Analyzing this complex, often sensitive data is essential for improving patient outcomes, optimizing resource allocation, managing costs, and informing public health policy.
Technical Deep Dive and Skill Development
This project involves using SQL to analyze a simulated dataset comprising patient records, medical conditions, hospital information, insurance providers, admission types, and billing amounts. Participants explore crucial questions such as:
- Which medical conditions are most prevalent within a specific population or hospital?
- Which hospitals handle the largest volume of patients or specific types of admissions?
- How do billing amounts vary by medical condition, admission type, or insurance provider?
- Are there trends in admission types (e.g., emergency vs. elective) over time?
The SQL skills developed are highly transferable and robust:
GROUP BYand Aggregations: For calculating the incidence of diseases, average lengths of stay, total billing amounts per hospital, or patient demographics.- Filtering (
WHEREandHAVING): To focus on specific patient cohorts, diagnoses, or time periods. JOINOperations: Crucial for connecting disparate tables, such as linking patient demographics to admission records, diagnoses, and billing information. Healthcare databases are often highly normalized, requiring multiple joins.- Aggregate Functions:
SUM,AVG,COUNTapplied across various dimensions to generate key performance indicators (KPIs) like average cost per patient, total admissions, or most frequent procedures. - Domain-Specific Analysis: Applying SQL to answer questions specific to the healthcare domain, demonstrating an understanding of medical terminology and processes. This often involves using
CASE WHENto categorize diagnoses or procedures into broader groups. - Data Privacy Considerations: While not strictly SQL syntax, understanding the importance of data anonymization and adherence to regulations like HIPAA (Health Insurance Portability and Accountability Act) is paramount when working with healthcare data, showcasing responsible data handling.
Implications and Industry Relevance
A well-executed healthcare data analysis project highlights a professional’s ability to work with meaningful, complex, and often sensitive real-world data. The insights derived can inform hospital management on resource allocation, identify areas for cost reduction, evaluate the effectiveness of treatment protocols, and support epidemiological studies. For example, identifying a surge in admissions for a particular respiratory illness might prompt a public health intervention. The global healthcare analytics market is expected to grow significantly, reaching over $100 billion by 2030, driven by the need for data-driven decision-making. To enhance a portfolio, the project should include a concise insights section or a dashboard mock-up, presenting key findings on healthcare KPIs, cost patterns, hospital activity, and patient admission trends. Professionals with these skills are highly sought after in health informatics, public health, hospital administration, and pharmaceutical research.
Conclusion: Crafting a Narrative with Data
The ultimate goal of building a data portfolio with SQL projects extends far beyond simply demonstrating query-writing ability. It is about showcasing a data analyst’s mindset: the capacity to transform raw data into a compelling narrative that addresses real business problems. This involves asking insightful questions, meticulously cleaning and exploring datasets, and translating complex findings into clear, actionable insights and recommendations.
The five projects outlined—customer churn analysis, data warehousing, sales performance analysis, banking segmentation, and healthcare data analysis—represent some of the most valuable and frequently encountered use cases in the professional data landscape. They offer diverse challenges and opportunities to apply a wide array of SQL techniques, from foundational aggregations and joins to advanced window functions and ETL processes.
When constructing a data portfolio, the emphasis should always be on quality over quantity. It is far more impactful to thoroughly complete and document one or two projects than to present a multitude of half-finished or poorly explained endeavors. For each project, ensure that:
- SQL Queries are Clean and Well-Commented: Demonstrating best practices in code readability.
- Process is Documented: Explaining the methodology, data sources, assumptions, and challenges encountered.
- Results are Clearly Explained: Articulating what the data reveals in a business-centric manner.
- Insights and Recommendations are Provided: Translating technical findings into strategic advice for stakeholders.
A small, meticulously documented project with a clear story and actionable insights will consistently outperform a large, complex project lacking clear articulation of its purpose and findings. As the data-driven economy continues to expand, SQL’s role as a foundational skill remains undisputed. By mastering these real-world projects, data professionals can effectively communicate their analytical prowess and strategic value to prospective employers, paving the way for successful careers in an ever-evolving field.
Abid Ali Awan is a certified data scientist professional with a strong focus on machine learning model development. He currently dedicates his expertise to content creation and authoring technical blogs covering machine learning and data science technologies. Holding a Master’s degree in technology management and a Bachelor’s degree in telecommunication engineering, Abid’s professional vision includes developing an AI product leveraging graph neural networks to support students facing mental health challenges.