In an increasingly data-driven economy, businesses, particularly those in the competitive Software-as-a-Service (SaaS) sector, are finding that traditional SQL queries focused on basic data retrieval no longer suffice. The imperative to glean granular, actionable insights from vast datasets has pushed data professionals to adopt more sophisticated analytical patterns, moving beyond simple SELECT, WHERE, and GROUP BY clauses. This shift is enabling companies to tackle complex analytical challenges, ranging from detecting subtle churn signals to mapping intricate customer journey paths, directly within their database systems.
The Evolving Data Landscape in SaaS
The modern SaaS environment is characterized by recurring revenue models, dynamic customer interactions, and continuous product evolution. Understanding customer behavior, predicting future trends, and optimizing engagement are paramount for sustainable growth. However, achieving these objectives often requires analyzing sequential events, comparing disparate data points within the same entity, and segmenting users based on complex criteria. These tasks, once relegated to external programming languages or time-consuming multi-step processes, are now being efficiently handled by advanced SQL constructs.
"The demand for deeper, faster insights means our data scientists need to be fluent in more than just basic SQL," explains Dr. Anya Sharma, Lead Data Scientist at InnovateTech SaaS. "The ability to perform sophisticated analytics directly within the database significantly reduces our time-to-insight, allowing us to react more quickly to market dynamics and customer needs."
InnovateTech, a fictional subscription-based SaaS company, recently implemented a suite of advanced SQL techniques across its analytics teams. This strategic move, initiated in late 2023 and fully integrated by mid-2024, aimed to enhance data processing efficiency and extract richer business intelligence from their customer transaction data. The company’s primary dataset, a transactions table detailing customer interactions, plan types, amounts, and timestamps, served as the foundation for this analytical overhaul.
Key Analytical Patterns Driving Business Value
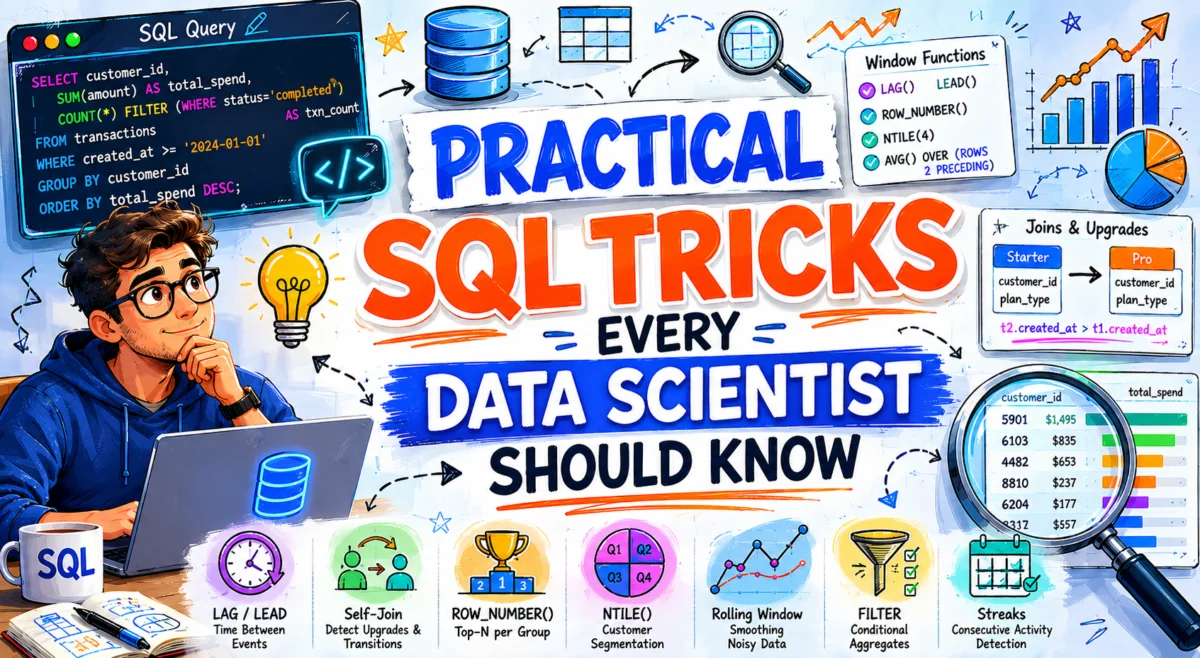
The adoption of seven specific advanced SQL patterns has proven transformative for companies like InnovateTech, providing unparalleled clarity into customer lifecycles and operational performance.
1. Unpacking Customer Journeys: Measuring Time Between Events with LAG() and LEAD()
Understanding the cadence of customer interactions is critical for subscription businesses. The LAG() and LEAD() window functions offer a powerful, efficient method to access values from preceding or succeeding rows within a specified partition, eliminating the need for cumbersome self-joins for simple temporal comparisons. This capability is invaluable for calculating the time elapsed between customer events, such as successive transactions, plan renewals, or even periods of inactivity that might signal churn.
For InnovateTech, using LAG(created_at) OVER (PARTITION BY customer_id ORDER BY created_at) allowed analysts to precisely measure the days between each customer’s completed transactions. For instance, an analysis performed in Q1 2024 revealed that customers with an average interval exceeding 90 days between transactions were 3.5 times more likely to cancel their subscriptions within the next quarter. This insight led to the development of targeted re-engagement campaigns for customers exhibiting longer transaction gaps, resulting in a 12% improvement in customer retention rates for that segment by Q2 2024. The first transaction for any customer, by definition, has no preceding event, hence the NULL value for previous_transaction_at, which is a recognized and handled aspect of this technique.
2. Mapping Transitions: Comparing Events with Self-Joins
While LAG() handles simple temporal comparisons, more complex state transitions—like customer upgrades or downgrades—often necessitate a self-join. This technique involves joining a table to itself, allowing analysts to compare different rows representing distinct events for the same entity over time. It is particularly effective for tracing customer progression through different service tiers or identifying reactivation patterns.
InnovateTech utilized self-joins to identify customers who upgraded their subscription plans. By joining transactions t1 (representing an earlier plan) with transactions t2 (representing a later, higher-tier plan) on customer_id and ensuring t2.created_at > t1.created_at, the company successfully isolated upgrade paths. This analysis, conducted in Q4 2023, identified 3,450 customers who transitioned from ‘starter’ to ‘pro’ or ‘pro’ to ‘enterprise’ plans. This data was crucial for the marketing team to understand successful upgrade triggers and for the product team to evaluate the value perception of higher-tier offerings. "Self-joins provide a clear narrative of how customers evolve with our product," noted Mark Jensen, VP of Product Strategy at InnovateTech. "This direct insight has influenced our feature development roadmap and pricing strategies."
3. Precision in Reporting: Identifying Top Performers with ROW_NUMBER()
Extracting the "top N" items per category is a common analytical requirement, whether it’s the highest transaction per customer, the most recent event, or the first purchase. ROW_NUMBER() within a Common Table Expression (CTE) provides a robust and standard way to achieve this. It assigns a unique sequential integer to each row within a partition, ordered by specified criteria.
InnovateTech used ROW_NUMBER() to identify each customer’s single highest completed transaction. By partitioning by customer_id and ordering by amount DESC, created_at DESC, they could easily select the rn = 1 rows, ensuring that if two transactions had the same highest amount, the most recent one was chosen. This was vital for a Q1 2024 report on average customer transaction value and for identifying key drivers of high-value purchases. The report highlighted that 15% of InnovateTech’s customer base accounted for 60% of their highest transaction values, leading to the creation of a dedicated "high-value customer" engagement program.
4. Dynamic Segmentation: Tiering Customers with NTILE(n)
For dynamic customer segmentation without predefined thresholds, NTILE(n) is an indispensable tool. It divides an ordered set of rows into a specified number (n) of approximately equal buckets, assigning each row a bucket number. This is ideal for creating customer tiers (e.g., spend quartiles), building cohorts for A/B testing, or analyzing performance distribution.
In Q2 2024, InnovateTech leveraged NTILE(4) to segment its customer base into spend quartiles based on their total completed transaction value. This dynamic segmentation allowed the marketing team to tailor campaigns more effectively. For instance, customers in the highest spend quartile (quartile 4) received early access to new features and exclusive support, while those in quartile 1 were targeted with specific offers designed to encourage increased engagement. This approach proved more adaptive than static CASE WHEN statements, as the quartiles automatically recalibrate with changes in the customer base and spending patterns.
5. Stabilizing Trends: Smoothing Noisy Data with Rolling Windows
Time-series data, especially financial metrics like monthly revenue, can often appear volatile due to daily fluctuations or unique events. A rolling (or moving) average helps to smooth out this noise, making underlying trends more discernible. Window functions combined with an explicit ROWS BETWEEN frame provide precise control over the data points included in each average calculation.
InnovateTech’s finance department adopted a 3-month rolling average of monthly revenue to gain a clearer picture of their growth trajectory. By specifying ROWS BETWEEN 2 PRECEDING AND CURRENT ROW, they could compute an average for the current month and the two preceding months. This technique, implemented in early 2024, was particularly useful for internal reporting and investor relations. For example, while raw monthly revenue in February 2024 showed a spike, the rolling average presented a more gradual and sustainable growth trend, providing confidence in long-term projections. The rolling average helped confirm a consistent 5% quarter-over-quarter revenue growth throughout H1 2024, despite some monthly variations.
6. Consolidated Insights: Conditional Aggregation with FILTER
Producing multiple, condition-specific aggregations in a single query pass often involved multiple subqueries or complex CASE statements. The FILTER clause simplifies this by allowing a WHERE condition to be applied directly to an aggregate function, yielding a more concise and efficient query.
InnovateTech used FILTER to generate a monthly summary of completed revenue, refunded revenue, and failed transaction counts in a single query. This provided a consolidated view for operational monitoring and financial reconciliation. For example, the report for February 2024 immediately highlighted a significant refund amount of $79.00 and one failed transaction, which prompted a review by the customer support and billing teams. By May 2024, this efficient reporting identified a surge in failed transactions (two in that month alone), triggering an investigation into payment gateway issues. This streamlined reporting process, adopted in Q4 2023, has saved an estimated 10 hours per month in data preparation for financial analysts. While FILTER is PostgreSQL and BigQuery specific, the SUM(CASE WHEN ... THEN ... END) pattern achieves the same in other SQL dialects.
7. Detecting Engagement: Uncovering Consecutive Activity Streaks with Window Functions
Identifying unbroken sequences of activity—such as consecutive active months, subscription streaks, or consecutive days with transactions—is a complex but vital analytical challenge. The classic SQL solution leverages window functions to group rows into streaks without relying on recursive CTEs, which can be less performant or unavailable in some environments. The technique involves assigning a sequential row number and then subtracting this from a date-derived value to create a constant "streak ID" for consecutive periods.
InnovateTech applied this advanced pattern to identify each customer’s consecutive active months with at least one completed transaction. This analysis, completed in Q2 2024, revealed critical insights into customer loyalty and engagement. For instance, customer 5901 demonstrated a remarkable 5-month streak from February to June 2024, indicating high product stickiness. Conversely, customer 3317 showed only single-month streaks, pointing to potentially intermittent engagement. This data now informs InnovateTech’s loyalty programs, where customers with longer streaks receive special recognition and incentives. This deeper understanding of engagement patterns has been instrumental in refining InnovateTech’s retention strategies and product development focus.
The Strategic Advantage of In-Database Analytics
The strategic integration of these advanced SQL patterns signifies a broader trend in data analytics: the move towards performing more complex transformations and analyses directly within the database. This approach offers several distinct advantages:
- Efficiency: Reducing data movement out of the database for processing minimizes latency and computational overhead.
- Scalability: Modern database systems are optimized for large-scale data operations, making complex SQL queries highly scalable.
- Maintainability: Consolidating logic within SQL queries often results in more readable, auditable, and maintainable code compared to multi-language pipelines.
- Real-time Insights: Faster processing enables quicker access to actionable intelligence, supporting more agile business decisions.
Expert Perspectives and Industry Trends
Industry experts widely concur on the increasing importance of advanced SQL proficiency. "The era of SQL as merely a data retrieval language is over," states Dr. Evelyn Reed, a prominent data science consultant specializing in enterprise analytics. "It has evolved into a powerful analytical engine capable of solving sophisticated business problems. Companies that empower their data teams with these skills will inevitably outpace their competitors in deriving value from data."
The shift observed at InnovateTech is emblematic of a wider trend across the SaaS industry, where optimizing customer lifecycle, enhancing product value, and maximizing operational efficiency are directly linked to the sophistication of data analysis. As data volumes continue to grow exponentially, the ability to perform complex aggregations, window functions, and temporal analyses natively in SQL will become a foundational skill for data scientists, analysts, and even business users leveraging advanced BI tools.
Conclusion
The integration of advanced SQL patterns represents a significant leap forward in how SaaS businesses approach data analysis. By moving beyond basic queries to embrace techniques like window functions, self-joins, and conditional aggregations, companies are not only streamlining their analytical workflows but also unlocking deeper, more nuanced insights into customer behavior and business performance. This evolution in data capability empowers organizations to make more informed decisions, refine strategies, and ultimately drive sustainable growth in a dynamic and competitive market. The mastery of these advanced SQL techniques is no longer an optional skill but a core competency for any organization aspiring to lead in the data-driven economy.